{}
Introduction to Ultrasound
Definition of Ultrasound
- Ultrasound (US) = sound with a frequency > 20 kHz; diagnostic medical US typically uses 2–15 MHz.
- Modern anaesthesia practice employs US for vascular access, regional blocks, neuraxial mapping, transthoracic (TTE) and trans-oesophageal echo (TOE), lung, gastric and airway scanning, focused obstetric assessments and haemodynamic Doppler studies.
Image Generation
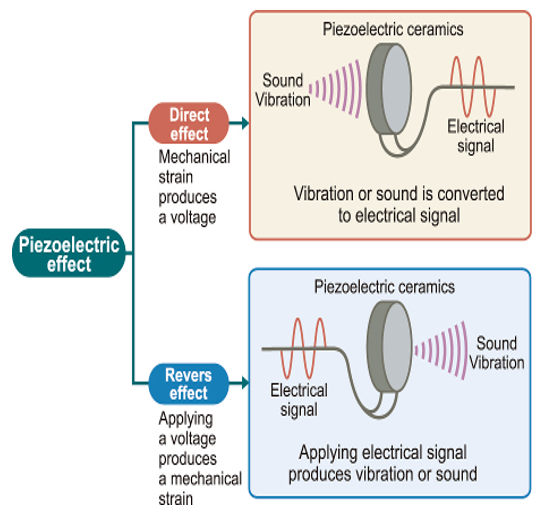
- Ultrasound images are traditionally created using the Piezoelectric Effect. This involves the vibration of a piezoelectric crystal at the tip of the transducer, generating ultrasonic frequencies that create ultrasound waves.
- Piezoelectric crystals are delicate and costly, with replacements costing thousands of dollars.
- The ultrasonic waves penetrate the body’s soft tissues and reflect back to the transducer. These returning waves are converted into ultrasound images displayed on a screen.
- Understanding the physics of waves is fundamental to grasping how ultrasound images are formed, how ultrasound artifacts occur, and how to use advanced ultrasound applications such as Doppler.
Does Echo Influence Survival Outcome
- Echo improves diagnostic accuracy but is not associated with improved survival or shorter hospital stay.
Evidence for Outcome Impact
- Vascular access–meta-analysis of 20 RCTs shows US guidance halves first-pass failure and arterial puncture during IJ cannulation.
- Regional anaesthesia–US reduces block failure and LAST, accelerates onset and lowers LA dose.
- Peri-operative TOE/TTE–observational data reveal change-of-management rates > 30 %; 2023 stepped-wedge RCT in high-risk non-cardiac surgery showed a 14 % relative reduction in major haemodynamic complications but no mortality signal at 30 days.
- Critical-care TTE–South-African multicentre cohort (ICU Echo SA 2024) linked early POCUS-guided fluid optimisation with shorter ventilator days; mortality benefit remains inconclusive.
Physics
Key Physics
- Frequency (f) = c/λ. Higher f → shorter wavelength → improved axial resolution but greater attenuation.
- Acoustic impedance (Z) = density × propagation speed. Reflection coefficient ∝ (Z₂–Z₁)²/(Z₂+Z₁)².
- Attenuation (dB cm⁻¹) rises with frequency and tissue type (bone ≈ 20, lung ≈ 12, muscle ≈ 1); compensation via time-gain controls.
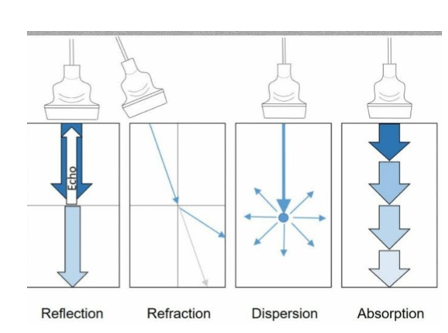
- Beam interactions–reflection, refraction (Snell’s law), scattering and absorption produce the artefacts below.
- Safety indices–Mechanical Index (MI < 1.9) limits cavitation risk; Thermal Index (TI) guides exposure time (TI < 1.0 for first-trimester obstetrics). Follow ALARA (As Low As Reasonably Achievable) principles.
Frequency and Wavelengths
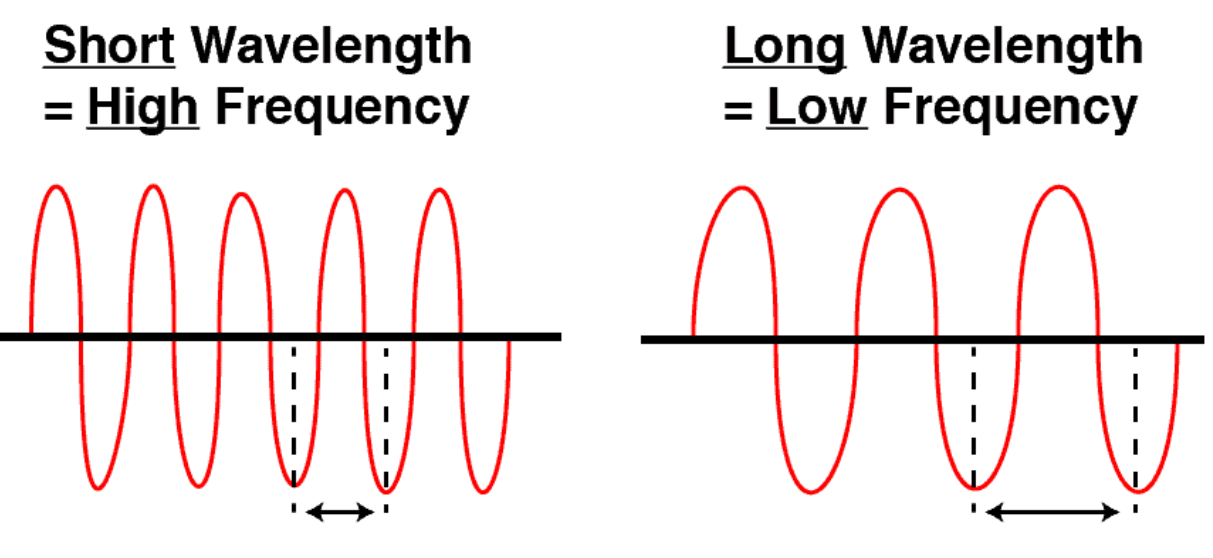
- Frequency: The number of sound wave cycles per second.
- Wavelength: The length or distance of a single cycle of a wave.
- Equation: Frequency = Speed of sound wave / Wavelength
- As wavelength increases, frequency decreases (and vice versa).
- Shorter wavelength = Higher frequency
- Longer wavelength = Lower frequency
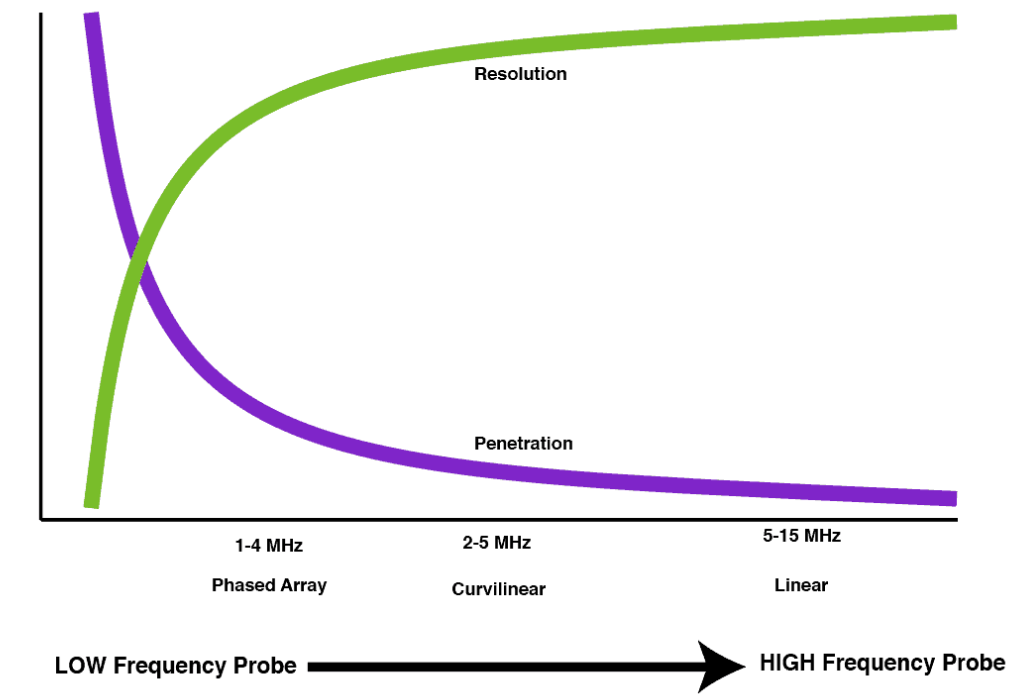
Impact of Frequency on Ultrasound Imaging
- High-Frequency Probes:
- Emit shorter wavelengths
- Provide better resolution
- Have decreased penetration
- Low-Frequency Probes:
- Emit longer wavelengths
- Provide deeper penetration
- Have lower resolution
Types of Probes and Their Characteristics
- Phased Array Probe: Great penetration, moderate resolution
- Curvilinear Probe: Good penetration, good resolution
- Linear Probe: Poor penetration, excellent resolution
Acoustic Impedance
- Definition: Acoustic impedance (Z) is the resistance to ultrasound propagation as it passes through a tissue.
- Equation: Impedance = Density x Propagation Speed of Sound Wave
- Dependence: Acoustic impedance is dependent on the tissue density and the speed of sound through that tissue.
- Effect: As tissue density increases, the impedance (resistance) increases as well.
Reflection of Ultrasound Waves
- Mechanism: Reflection occurs when ultrasound waves encounter the interface of two tissues with significantly different impedance values.
- Proportion: The proportion of reflected ultrasound waves is proportional to the difference in impedance between the two tissues.
- Example: Bone and air appear as bright lines on ultrasound due to the large impedance difference from soft tissue, causing almost all ultrasound waves to reflect back.
- Impedance Values: Air (0.0004), Bone (12), Soft tissue (1.6).
Refraction of Ultrasound Waves
- Mechanism: Refraction occurs when ultrasound waves encounter tissues with slightly different impedance values.
- Effect: The speed of the ultrasound waves changes, causing a change in direction (refraction).
- Dependence: The degree of refraction depends on the angle of incidence and the change in speed in the second medium.
- Example: Refraction is seen at the rounded interfaces between fluid-filled structures and adjacent soft tissues, causing edge artifacts such as black lines from the edges of structures like the gallbladder, cysts, vessels, and bladder.
Attenuation–Absorption
- Definition: Attenuation is the loss and absorption of ultrasound energy as it passes through a medium.
- Effect: Describes how rapidly a medium reduces the intensity of an ultrasound wave.
- High Attenuation Mediums: Air and bone have the highest attenuation.
- Dependence: Unlike impedance, attenuation is not solely dependent on the density of the material.
Doppler Effect
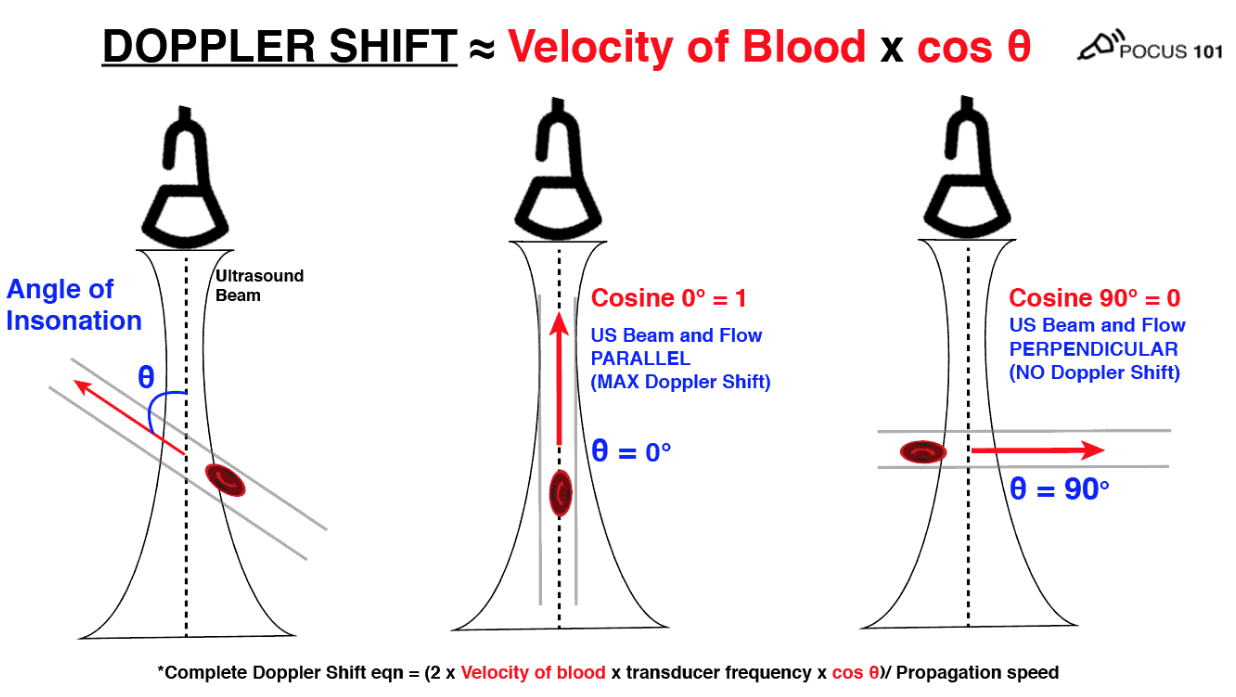
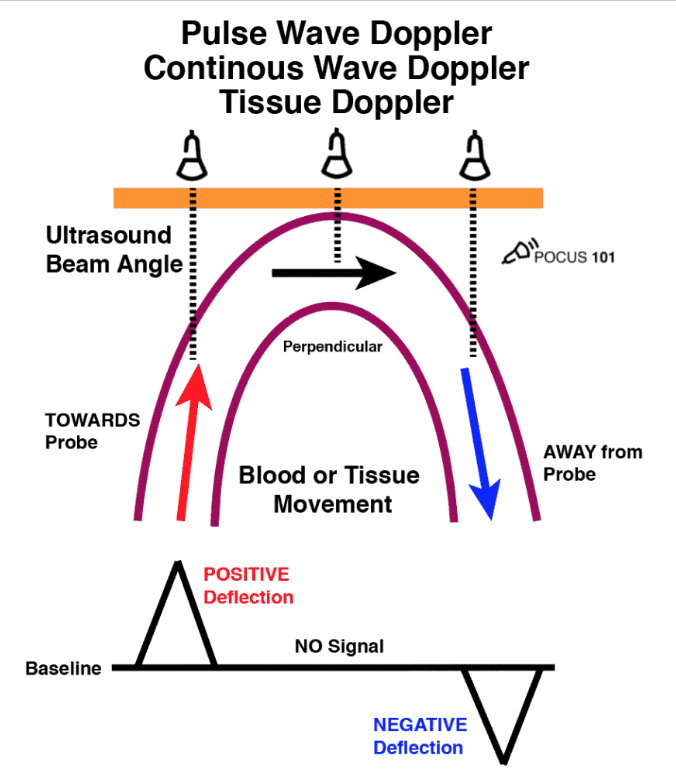
- Definition: The Doppler Effect (or Doppler Shift) evaluates movement either towards or away from the ultrasound probe/transducer. Commonly used to detect blood movement, but can also evaluate tissue and muscle movement.
- Essentials
- Doppler shift (Δf) = 2 v f₀ cos θ / c.
- Keep insonation angle < 20 °; at 90 ° no flow is detected.
- Aliasing occurs when |Δf| > ½ PRF; increase scale, decrease depth or use CW.
Doppler Shift Equation
- Equation: Doppler Shift = (2 x Velocity of blood x Transducer frequency x cos θ) / Propagation speed
- θ: Angle of Insonation (angle of incidence between the ultrasound beam and the direction of flow).
- Dependence: The Doppler shift is primarily related to:
- The velocity of the blood cells.
- The angle of insonation.
- Technique: For accurate Doppler measurements, ensure the movement is parallel to the ultrasound probe (0 degrees). Angles above 25-30 degrees will significantly underestimate measurements. At 90 degrees, the Doppler will read no flow due to the cosine of 90 degrees being 0.
Note: While using the velocity of blood as an example, the same principles apply when measuring muscle movement using tissue Doppler.
Common Artefacts (recognition Prevents misdiagnosis)
| Artefact | Cause | Typical appearance |
|---|---|---|
| Mirror image | Strong reflector + air | Duplicate organ deep to diaphragm |
| Acoustic shadow | High attenuation (bone, gallstone) | Black shadow distal to object |
| Posterior enhancement | Low attenuation fluid | Bright distal field behind cyst/bladder |
| Edge shadow | Refraction at curved wall | Linear dropout from vessel edge |
| Reverberation / A-lines | Multiple reflections | Equidistant horizontal lines (lung) |
| Comet-tail | Closely spaced reflectors | Tapering tri-angular echo (metal needle) |
| Ring-down / B-lines | Resonant air–fluid | Vertical laser-like line to bottom |
| Side-lobe / grating | Off-axis beam energy | Ghost echo e.g. “clot” in left atrium |
Probes
| Foot-print | Array | Usual MHz | Resolution ↑ | Penetration ↑ | Typical use |
|---|---|---|---|---|---|
| Linear | 128–256 elements | 5–15 | | – | Vascular, nerve, lung, paediatric |
| Curvilinear | 64–128 | 2–8 | | | FAST, abdominal, obstetric |
| Phased-array | 64–128 | 1.5–5 | | | Cardiac, trans-cranial, rib spaces |
- Piezo-electric crystals convert electrical ↔ mechanical energy (classically lead-zirconate-titanate).
- Emerging CMUT/PMUT silicon transducers offer wider bandwidth and reduced cable bulk.
- Probe care: avoid alcohol-based wipes on lens; micro-cracks cause delamination and infection-control failure.
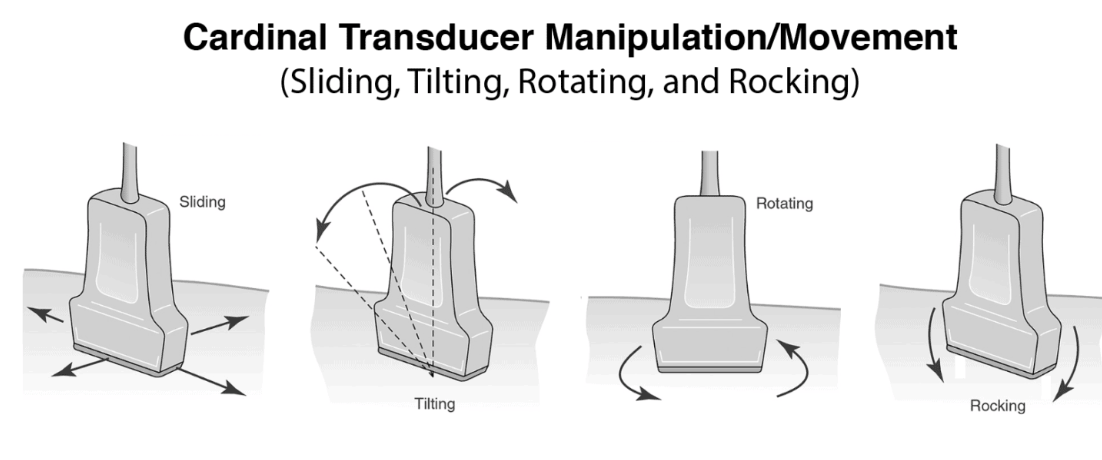
Probe Movement
- Only do one movement at a time. 1mm of movement of probe on patient is 2cm on screen
- Depth → centre region of interest at ½–⅔ screen; single focal zone at that depth.
- Overall gain for uniform grey; TGC sliders flatten banding.
- Rock (heel-toe), slide, tilt and rotate–one plane at a time; 1 mm on skin ≈ 20 mm on screen (~×20 magnification).
Modes of Ultrasound
| Mode | Information | Anaesthetic application |
|---|---|---|
| B-mode (2D) | Brightness map of echo amplitude | Core of all POCUS |
| M-mode | Motion along a single line vs time | Lung sliding, TAPSE, fetal HR |
| Colour Doppler | Direction & mean velocity (BART rule) | Valve screening, shunts, IV line patency |
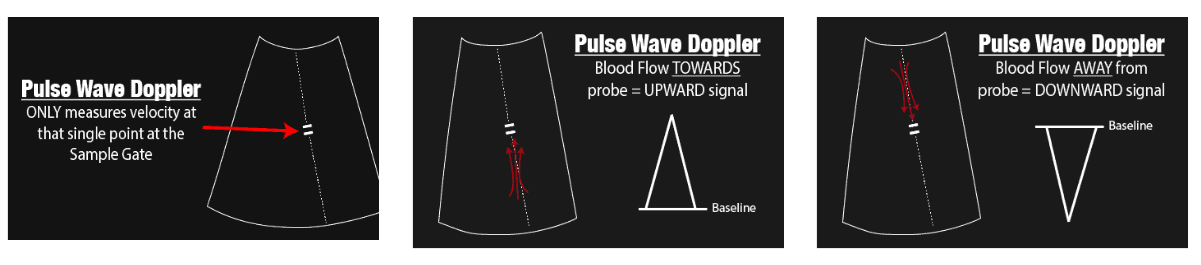
| Pulse-wave Doppler | Point velocity profile (Nyquist-limited) Measures the velocity of blood flow at a single point using a sample gate. Limitation: Maximum speed detectable is limited by the Nyquist Limit; aliasing occurs if this limit is exceeded. Not suitable for high-velocity applications (>200 cm/s). |
LVOT VTI for CO, diastolic function |
| Continuous-wave Doppler | Unlimited high velocity Measures all points along the cursor line and can detect very high velocities (>1000 cm/s). It does not alias. |
Aortic stenosis, severe regurgitation |
| Tissue Doppler / strain | Low-velocity myocardial or diaphragmatic motion A form of Pulse Wave Doppler designed to measure slower speeds of tissue/muscle movement (1 cm/s–20 cm/s). |
Weaning readiness, diastolic grading |
| Harmonic imaging | Receives at 2f; improves contrast | Obesity, deep nerve blocks |
| 3D/4D TOE | Volumetric valve assessment | Mitral clip, complex cardiac surgery |
Pulse Wave (PW) Doppler Mode
Basics of Operation
Positioning
Stand on the left side of the patient with the probe in the right hand. The patient should be in the left lateral position with the arm above the head.
Probe Marker Orientation
Locate the marker on the screen. With echocardiography, the marker is on the right side and corresponds to the marker on the cardiac probe.
Probe Movement
You can slide, rotate, rock (parallel to probe marker—rock the foot), or tilt (perpendicular to probe marker—tilt the tail) the transducer. Attempt to perform only one movement at a time. Note that 1 mm of movement of the probe on the patient equates to 2 cm on the screen.
Optimising the Image
- Depth: A centimetre scale is seen on the side of the screen indicating the depth of tissue being scanned. Adjust the depth to ensure the entire structure being evaluated or the area of interest is visible on the screen.
- Gain: Adjust the intensity of returning echoes shown on the screen. Increasing the gain will brighten the display, while decreasing the gain will darken it.
- Time Gain Compensation: Adjusts the gain at varying depths using multiple slider levers.
- Focus Point: Define the area you want to focus on.
Basic Mode (B-Mode) and Motion Mode (M-Mode)
- Gain (Brightness)
- Depth
- Time gain compensation
- Frequency (use higher frequency for more superficial structures, usually 2-4 MHz)
- Focus point
- I-beam (compounding—smooths the picture)
- Grey map (choose the grey scale)
- Zoom (enhances the view, especially useful for M-mode)
Doppler (Pulse Wave Doppler – PW)
- If the indicator is green, it is active, and you can move it.
- Adjust sample volume (size measured). The sample volume should never be less than the diameter of the vessel and never more than 2/3 of the diameter.
- Steer: Change the direction of measurement.
- Quick angle: Change to 60 degrees and maintain steer.
- Use finite angle adjustment for further angle adjustments.
- I-touch: Automatically adjusts scale and baseline.
- Can invert the image and adjust the baseline.
- Adjust the scale to fit the entire waveform.
- Duplex: Simultaneous live imaging and Doppler.
- Sweep speed: Adjusts the number of waves.
Color Doppler
- BART mnemonic: Blue AWAY, Red TOWARDS.
- Adjust the size and steer the box.
- Gain will adjust color.
- Utilizes pulsed wave Doppler and the Doppler equation to generate colors.
- Aliasing: Blood velocity moving faster than the analyzing frequency shift, leading to misinterpretation.
- Best interpreted when the box is placed inline with blood flow. Aim for cos=0 degrees (cos0=1). If not inline, the angle of observation (cos) will increase and underestimate the velocity of blood flow.
- A larger box will decrease the frame rate, so keep the box as small as possible while including all the areas you want to assess.
CARDIAC and Fluid Responsiveness
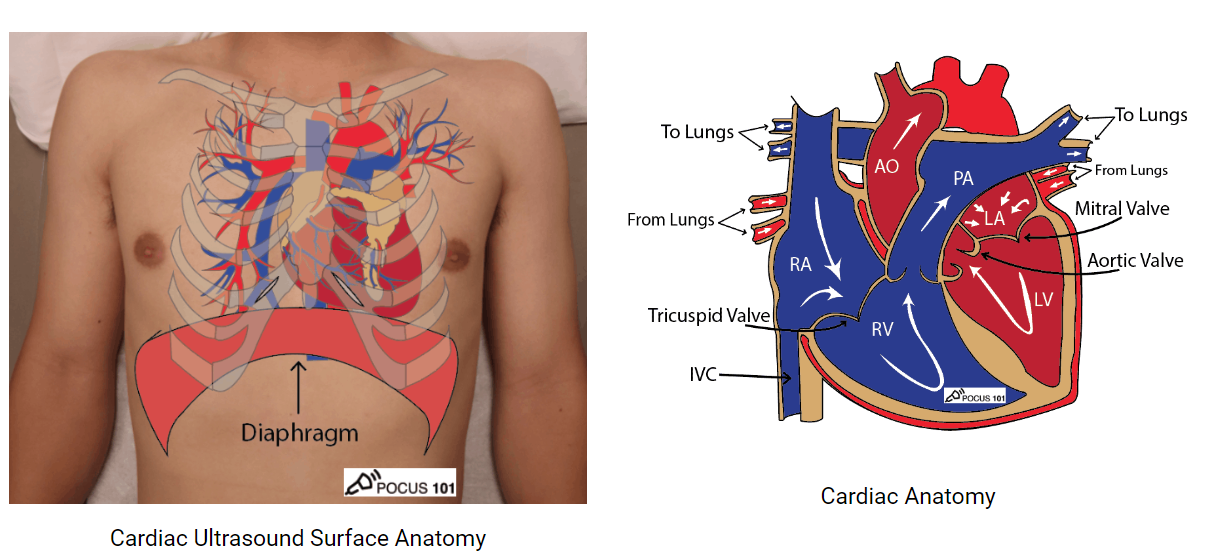
- Patient position: Attempt in Left lateral position or place pillow beneath right shoulder. Might require patient to hold breath for more adequate view.
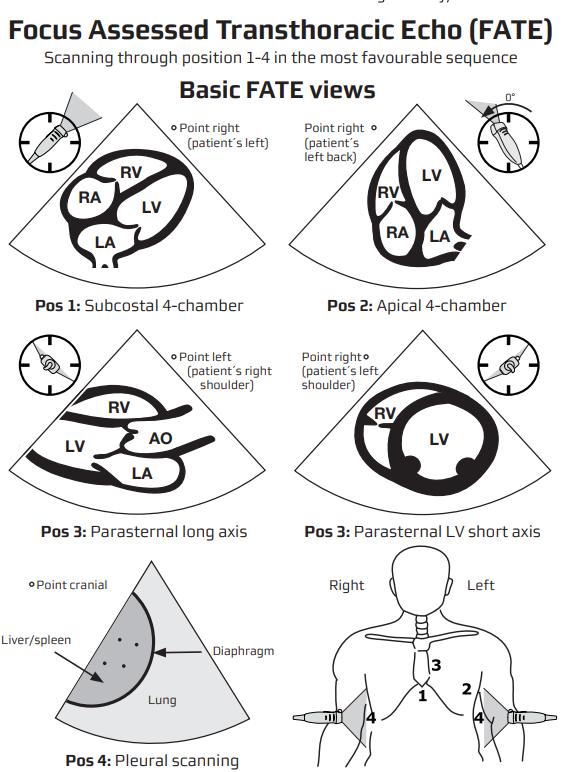
Views
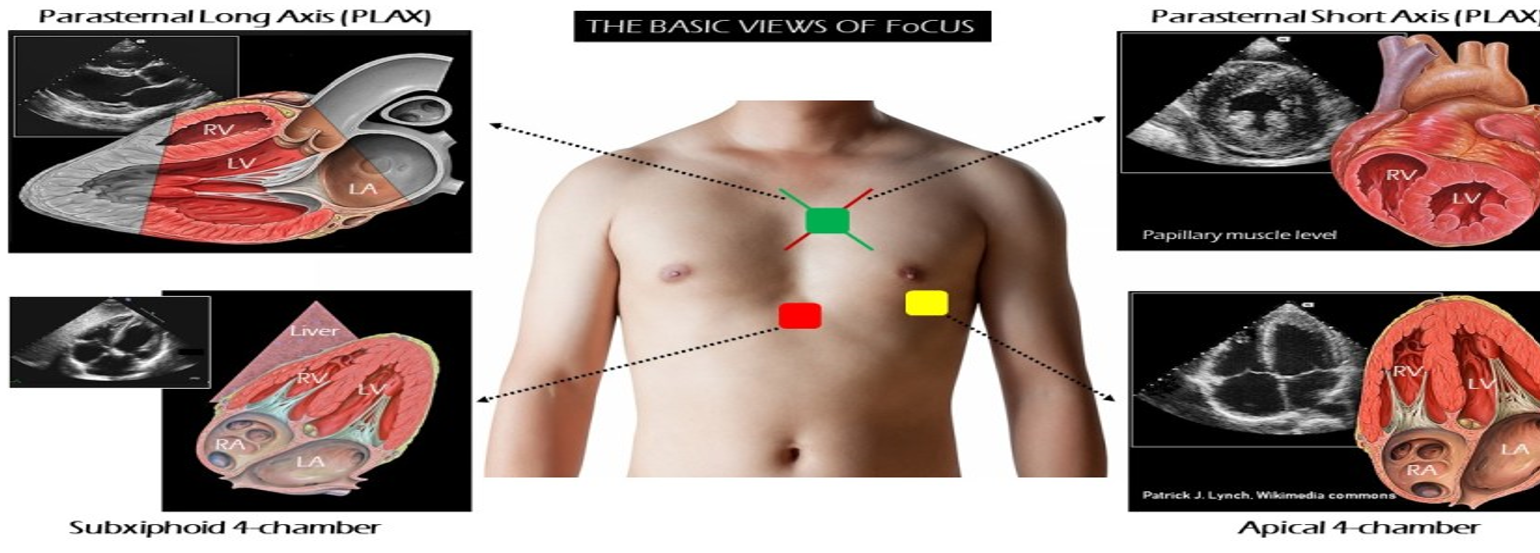
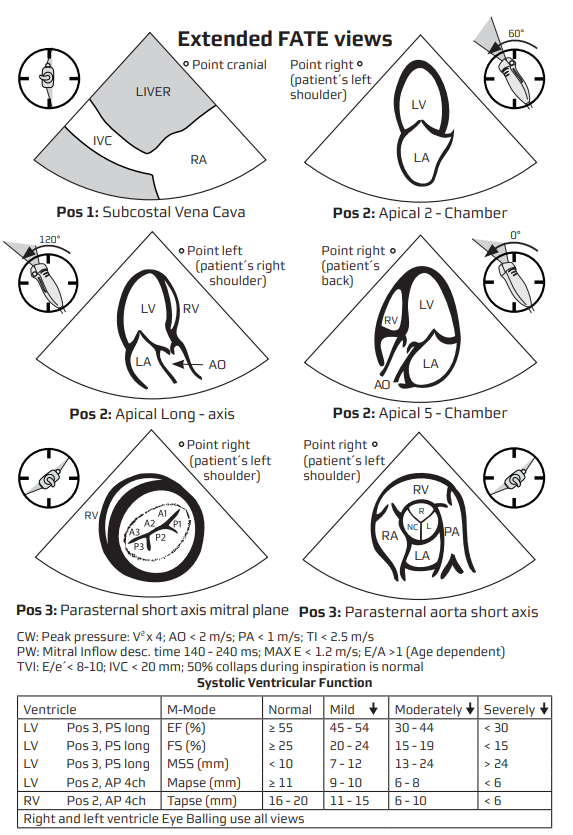
Patient Set-up & Probe Orientation
- Position–left lateral decubitus for parasternal / apical views; supine with knees flexed for subcostal & IVC.
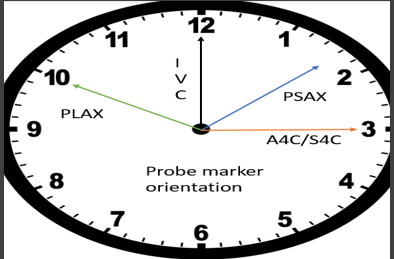
- Probe markers (screen-left)
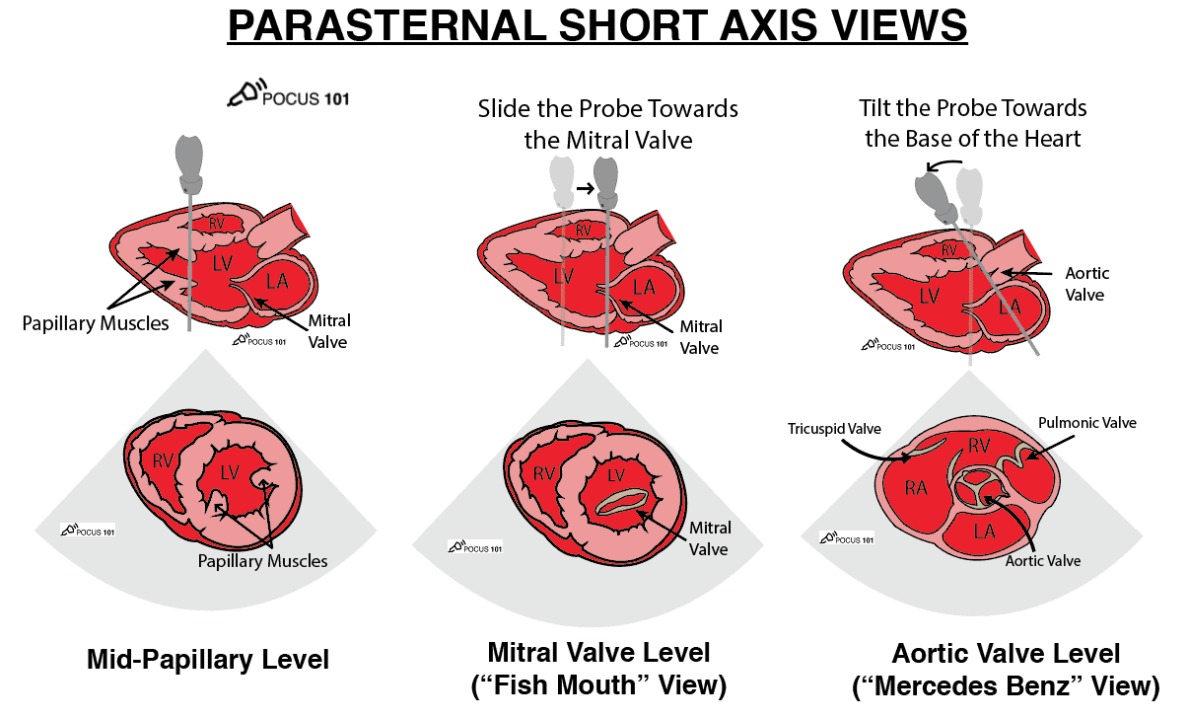
- PLAX 10 o’clock → right shoulder * PSAX 1 o’clock → left shoulder
- Apical series 3 o’clock → left flank * Subcostal 12 o’clock → patient’s hea
- Use phased-array 1.5–5 MHz; depth 16–20 cm (parasternal) or 12 cm (apical).
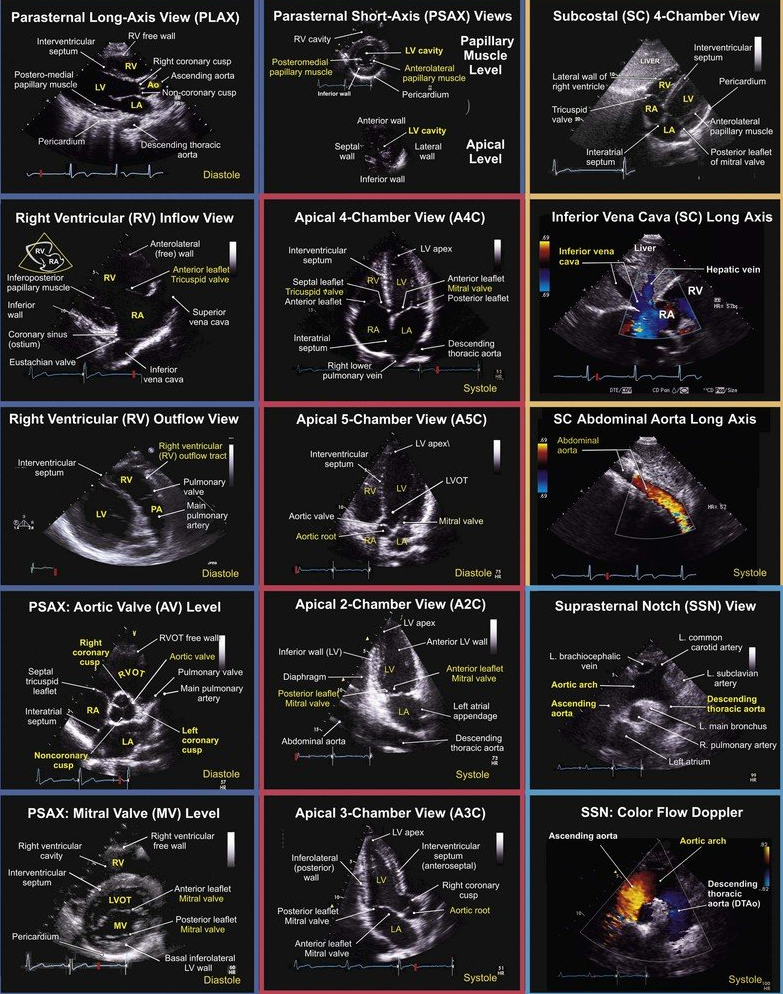
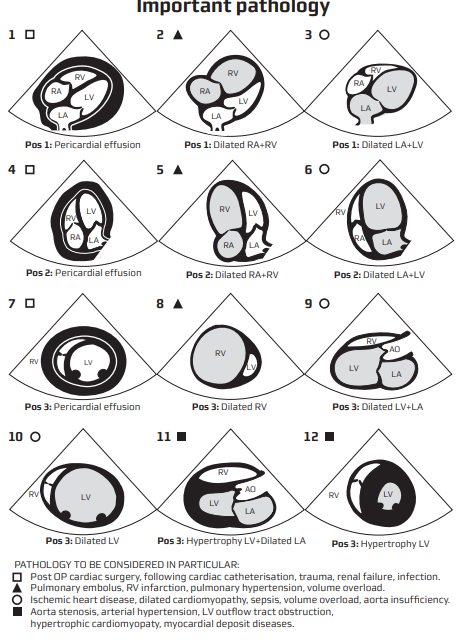
Core FoCUS Views & Key Questions
| View | Probe tips | Binary questions |
|---|---|---|
| PLAX | 2-4 ICS, LSB, marker right shoulder | LV contractility adequate? RV / LA / aortic root size normal? Pericardial effusion? |
| PSAX (aortic, mitral, papillary levels) | Rotate 60–90° clockwise | Global LV systolic function? Septal “D-shape” (RV pressure/volume overload)? |
| Apical 4-/5-/2-/3-chamber | Apex beat, marker 3 o’clock | LV/RV size & function? Valvular regurgitation? Stroke volume / VTI? |
| Subcostal 4-chamber & IVC | 1–2 cm below xiphisternum | Tamponade? IVC calibre & variation? |
Qualitative and Semi-quantitative Check-list
| Variable | Normal reference | Rapid screen |
|---|---|---|
| LV wall thickening | > 40 % systolic thickening | “Eyeball” squeeze & wall inward motion |
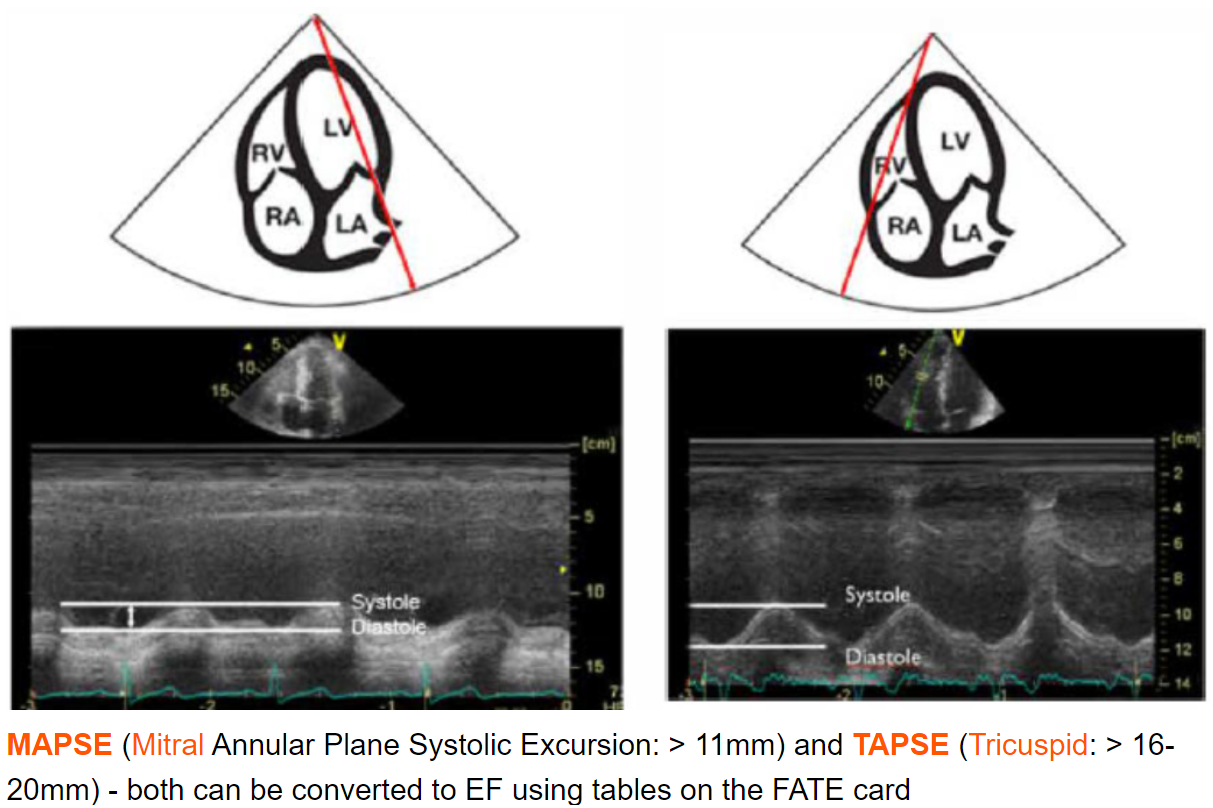
| EPSS | < 7 mm | M-mode PLAX |
| MAPSE | ≥ 12 mm lateral annulus | M-mode apical |
| RV size | RV ≲ ⅔ LV in A4C | Compare basal widths |
| TAPSE | ≥ 17 mm | M-mode tricuspid annulus |
| S’ (TDI) | ≥ 9.5 cm s⁻¹ | PW-TDI RV free wall |
| IVC (spont. breath) | ≤ 2.1 cm or collapsibility > 50 % | Subcostal long axis |
| IVC (ventilated) | Distensibility > 18 % | Measure during resp. cycle |
Quantitative Systolic Assessment
- Teichholz / fractional shortening (PLAX M-mode) when image quality limits 2D methods.
- Biplane Simpson (LVEF) from A4C & A2C–gold standard for bedside echo.
- MAPSE (lateral + septal) average correlates with LVEF; quick surrogate when time-critical.
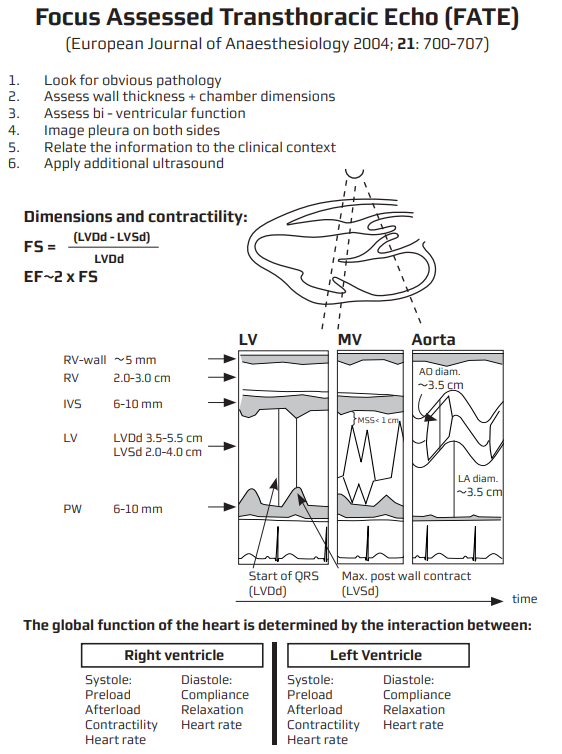
MAPSE
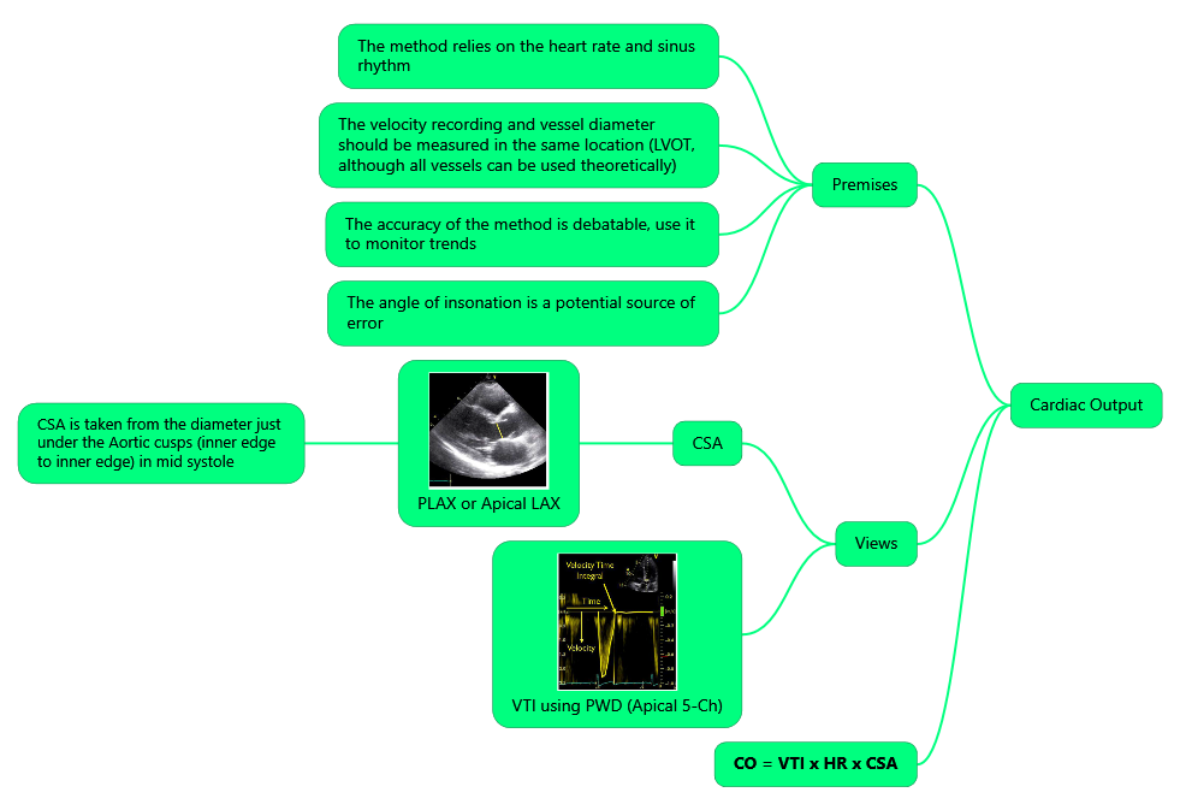
Stroke Volume & Fluid Responsiveness
- Stroke volume (SV) = π (LVOT ø / 2)² × LVOT VTI
- Measure LVOT diameter (mid-systole, PLAX) once unless physiology changes.
- Acquire PW-Doppler in A5C with sample at LVOT; optimise angle (θ < 20°) & trace VTI.
- Normal VTI 18–22 cm.
- Dynamic tests
- Passive leg raise (PLR) or 200 mL crystalloid bolus.
- Responder = ≥ 10–12 % rise in VTI (meta-analysis AUROC 0.88).
- Combine with IVC distensibility or carotid VTI for ventilated patients when apical window is poor
- Caution–unreliable in significant aortic or mitral regurgitation, arrhythmias, LVOT obstruction.
Cardiac Output
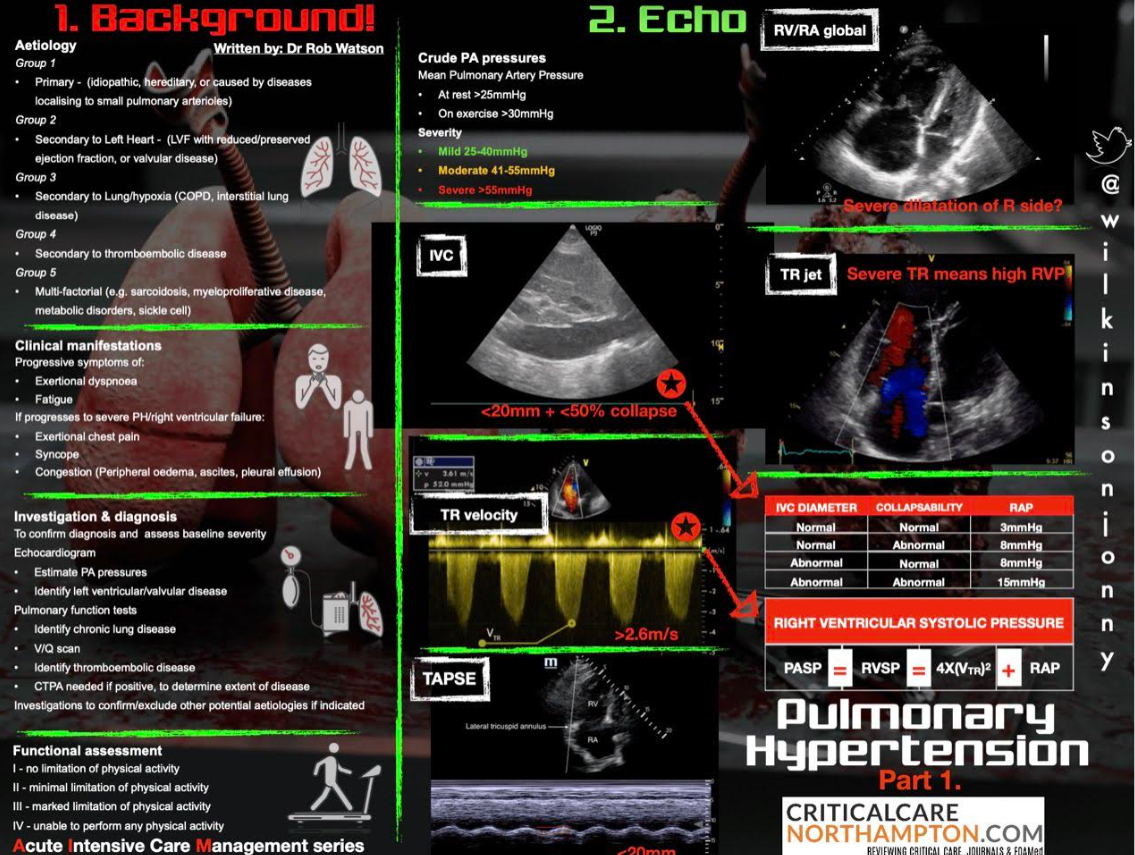
Right-heart Strain & Pulmonary Hypertension Screen
| Sign | Finding |
|---|---|
| RV/LV basal ratio > 1 (A4C) | Dilated RV |
| Septal flattening (“D-shape”) in PSAX | RV pressure overload |
| TAPSE < 17 mm or S’ < 9.5 cm s⁻¹ | RV systolic dysfunction |
| McConnell sign | Akinesis mid-free wall with preserved apex (suggests acute PE) |
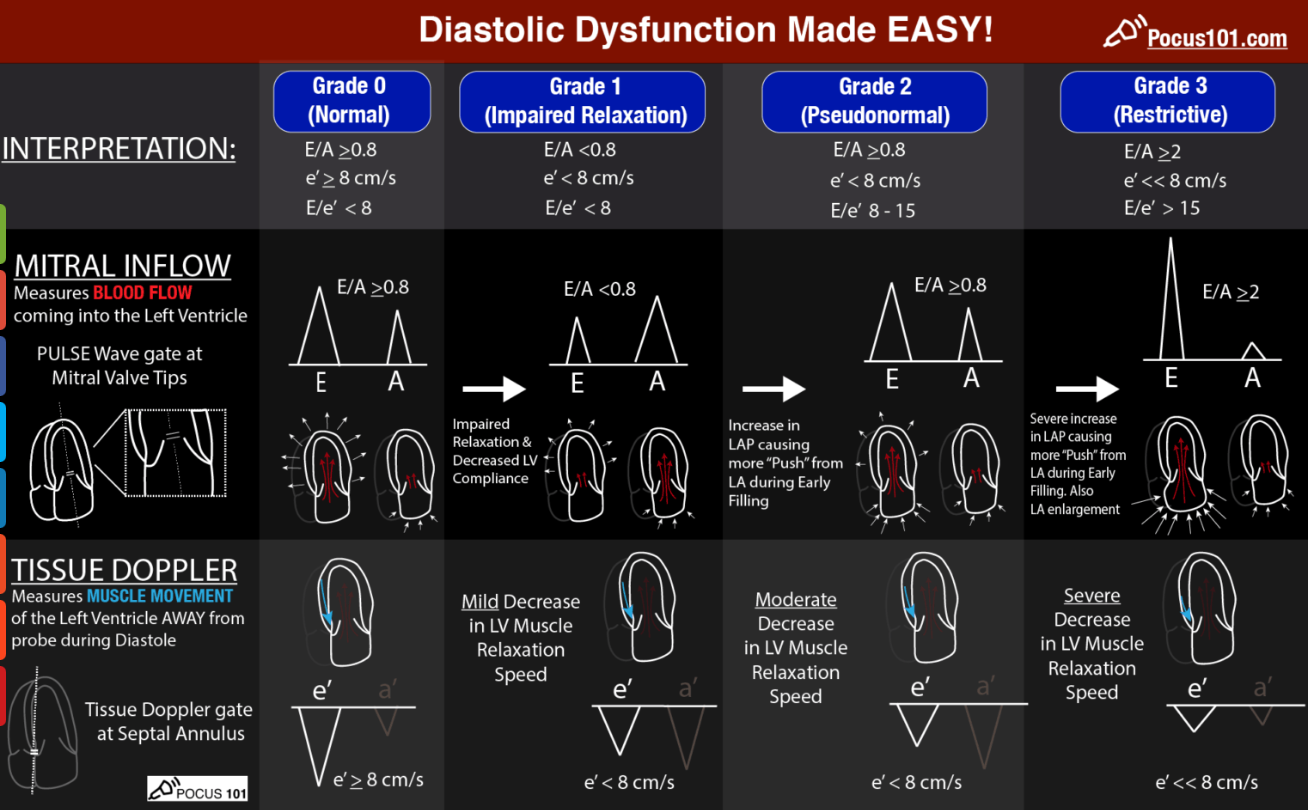
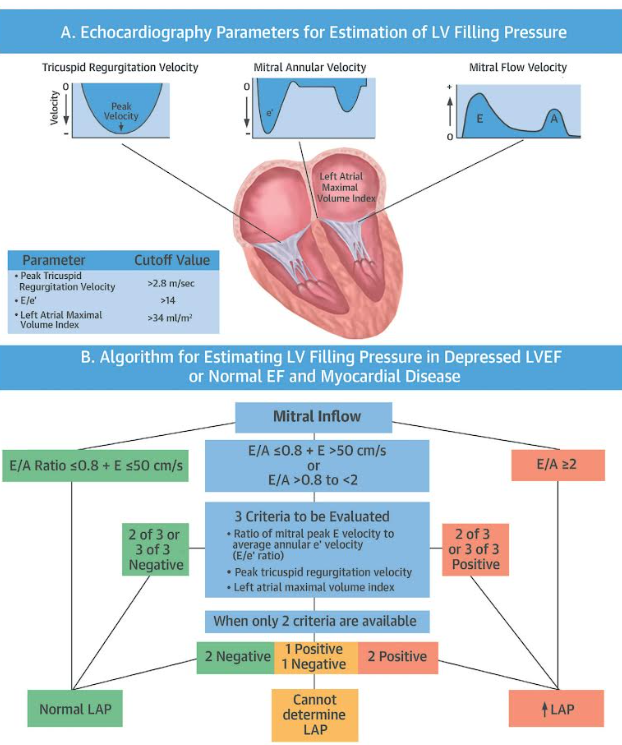
Left-ventricular Diastolic Dysfunction (LVDD)
| Step | Acquisition | Measurement | Key cut-offs* | Interpretation |
|---|---|---|---|---|
| 1 | A4C–PW-Doppler at MV leaflet tips | Mitral inflow E/A ratio & E-wave deceleration time (DT) | Normal adult: E/A 1–2 & DT 160–240 ms | E<A ⇒ impaired relaxation (Grade I) • E/A > 2 & DT < 160 ms ⇒ restrictive (Grade III–IV) |
| 2 | A4C–TDI at septal & lateral annulus | Early annular velocity e’ (cm s⁻¹) | Septal e’ < 7 or Lateral e’ < 10 → abnormal relaxation | Distinguishes pseudonormal (Grade II) from normal pattern |
| 3 | Calculate E/e’ (average e’) | Surrogate LV filling pressure | E/e’ < 8 normal • 8–14 indeterminate • > 15 raised | > 15 suggests LVEDP > 15 mmHg and poor fluid tolerance |
| 4 | A4C–planimetry or M-mode | LA volume index (LAVi) | > 34 mL m⁻² chronic elevation | Confirms chronic LVDD when E/e’ equivocal |
| 5 | TR jet (CW Doppler) | TR Vmax (m s⁻¹) | > 2.8 m s⁻¹ suggests ↑ pulmonary pressures | Supports Grade II–III if two major criteria positive |
- *Cut-offs from ASE/EACVI 2016 guidance, validated in peri-operative cohorts 2019-2024.
Bedside algorithm (simplified for FoCUS)
- Acquire mitral inflow & septal e’.
- If E/A < 0.8 and E < 50 cm s⁻¹ → Grade I (relaxation defect).
- If E/A > 2.0 → Grade III/IV (restrictive).
- Otherwise calculate E/e’:
- E/e’ ≤ 8 → normal filling (Grade 0).
- E/e’ ≥ 15 or LAVi > 34 or TR Vmax > 2.8 m s⁻¹ → Grade II (pseudonormal).
- If 1 of 3 supportive signs only → indeterminate; reassess with load manipulation or TTE.
Clinical implications for the anaesthetist
- Raised filling pressure (E/e’ > 15) → low fluid reserve, tolerate higher PEEP poorly; prefer vasopressor over fluid bolus.
- Grade III–IV LVDD associated with two-fold increase in peri-operative pulmonary oedema and ICU length-of-stay.
- In septic shock, high E/e’ predicts failure of liberal fluid strategy—supporting Doppler-guided resuscitation algorithms.
- Consider intra-operative diastolic-tailored goals: MAP > 65 mmHg, pulse pressure < 60 mmHg, heart-rate optimisation (β-blockade or pacing) to prolong filling time.
Evidence Snapshot (2018–2025)
- LVOT-VTI change ≥ 10 % after PLR predicts fluid responsiveness with pooled sensitivity 0.86 & specificity 0.88–2024 systematic review of 34 studies
- Critical-care ultrasound-guided resuscitation in septic shock reduced 28-day mortality and ICU length of stay in 2025 multicentre RCT (n = 480)
- Ultrasound-tailored fluids outperformed usual care in septic shock–2024 ECCM meta-analysis; best performance with IVC + PLR protocols
- EACTS/EACTAIC 2025 guideline endorses goal-directed fluid therapy using Doppler-derived SV change in high-risk cardiac and major vascular surgery
- South-African review (JTCCM 2024) highlights FoCUS as feasible first-line tool in low-resource ICUs
Pitfalls & Tips
- Far-field foreshortening of LV apex gives false-low VTI–slide laterally until true apex.
- Under-filled LV mimics poor contractility; always integrate IVC/clinical picture
- Arrhythmia–average ≥ 5 beats for Doppler measurements.
- LVOTO in severe hypovolaemia; beware spuriously high VTI.
Valvulopathies – Step-by-step Echocardiographic Diagnosis
General Systematic Approach (all valves)
- Leaflet morphology & motion–assess for thickening, calcification, prolapse, flail, restricted motion.
- Colour Doppler
- Antegrade turbulence → suspect stenosis.
- Retrograde jet → regurgitation; inspect vena contracta and proximal isovelocity convergence (PISA).
- Optimise spectral Doppler
- Align beam ≤ 20 ° with flow.
- Raise velocity scale (Nyquist ≥ 60 cm s⁻¹), shift baseline, shorten sample depth, or choose higher-frequency probe to avoid aliasing.
- Quantify severity–use at least two quantitative and one supportive parameter (guideline requirement).
- Look for sequelae–chamber enlargement, ventricular hypertrophy, pulmonary or systemic hypertension.
Aortic Valve
| Parameter (TTE) | Mild | Moderate | Severe |
|---|---|---|---|
| Stenosis – measured in ≥ 2 windows (A5C, suprasternal, right parasternal) | |||
| Peak velocity (Vₘₐₓ) | 2.6–2.9 m s⁻¹ | 3.0–3.9 | ≥ 4.0 |
| Mean gradient | < 20 mmHg | 20–39 | ≥ 40 |
| Valve area (AVA, continuity) | > 1.5 cm² | 1.0–1.5 | < 1.0 |
| Dimensionless index (LVOT VTI / AV VTI) | > 0.5 | 0.25–0.50 | < 0.25 |
| Regurgitation–A5C / PLAX colour + CWD | |||
| VC width | < 3 mm | 3–6 | > 6 |
| Jet/LVOT width | < 25 % | 25–65 % | > 65 % |
| PHT (ms) | > 500 | 200–500 | < 200 |
| Regurgitant vol (ml) | < 30 | 30–59 | ≥ 60 |
| Desc. aorta holodiastolic reversal | Absent | — | Present (> 20 cm s⁻¹ end-diastolic) |
- Tips
- Measure LVOT diameter inner-edge to inner-edge in mid-systole (zoomed PLAX).
- Late-peaking (crescendo) CWD curve ➜ severe AS with low flow.
- Always calculate stroke volume to confirm “low-flow low-gradient” AS.
Mitral Valve
| Parameter | Mild | Moderate | Severe |
|---|---|---|---|
| Stenosis (PLAX/A4C zoom + CW) | |||
| Mitral valve area (planimetry) | 1.5–2.5 cm² | 1.0–1.5 | < 1.0 |
| Mean gradient (HR 60–80 bpm) | < 5 mmHg | 5–10 | > 10 |
| PHT (ms) | < 150 | 150–220 | > 220 |
| SPAP (from TR jet) | < 30 mmHg | 30–50 | > 50 |
| Regurgitation (A4C/A2C colour + CW) | |||
| VC width | < 3 mm | 3–7 | ≥ 7 |
| Effective regurgitant orifice (EROA) | < 0.20 cm² | 0.20–0.39 | ≥ 0.40 |
| Regurgitant volume | < 30 ml | 30–59 | ≥ 60 |
| Pulmonary vein systolic flow | Normal | Blunted | Reversed |
- Primary MR–leaflet or chordae pathology; secondary MR–annular dilatation / LV dysfunction: quantify both and report mechanism (Carpentier classification)
Tricuspid Valve
| Parameter | Mild | Moderate | Severe |
|---|---|---|---|
| Regurgitation (A4C/S4C/subcostal) | |||
| VC width | < 0.5 cm | 0.5–0.6 | ≥ 0.7 cm or non-visualisable because too large |
| PISA EROA | < 0.20 cm² | 0.20–0.39 | ≥ 0.40 |
| Regurgitant jet area (not stand-alone) | < 5 cm² | 5–10 | > 10 |
| Systolic hepatic vein flow | Normal | S–blunted | S-flow reversal |
| Stenosis | |||
| Mean gradient (CW) | — | 2–5 mmHg | ≥ 5 mmHg |
| Valve area (continuity) | — | 1.0–1.5 cm² | < 1.0 cm² |
Pulmonary Valve
| Parameter | Mild | Moderate | Severe |
|---|---|---|---|
| Stenosis (PSAX PV level + CW) | Peak gradient | 36–64 mmHg | ≥ 64 mmHg |
| Regurgitation | VC width | — | ≥ 0.6 cm or diastolic flow reversal in PA |
Supportive and Integrative Signs (all Regurgitant lesions)
- LV / RV / LA / RA enlargement commensurate with volume overload.
- Pressure overload sequelae–concentric LVH (AS), septal flattening (severe TR / PR).
- Exercise TTE when resting assessment indeterminate but symptoms disproportionate.
Practical Acquisition Pearls
- Use 3–5 continuous-wave envelopes at sweep 50–100 mm s⁻¹; trace the highest waveform.
- Average measurements in sinus rhythm; in AF use ≥ 5 cycles.
- Re-check blood pressure when calculating gradients; systemic hypertension can exaggerate MR/AR severity.
Lung Ultrasound
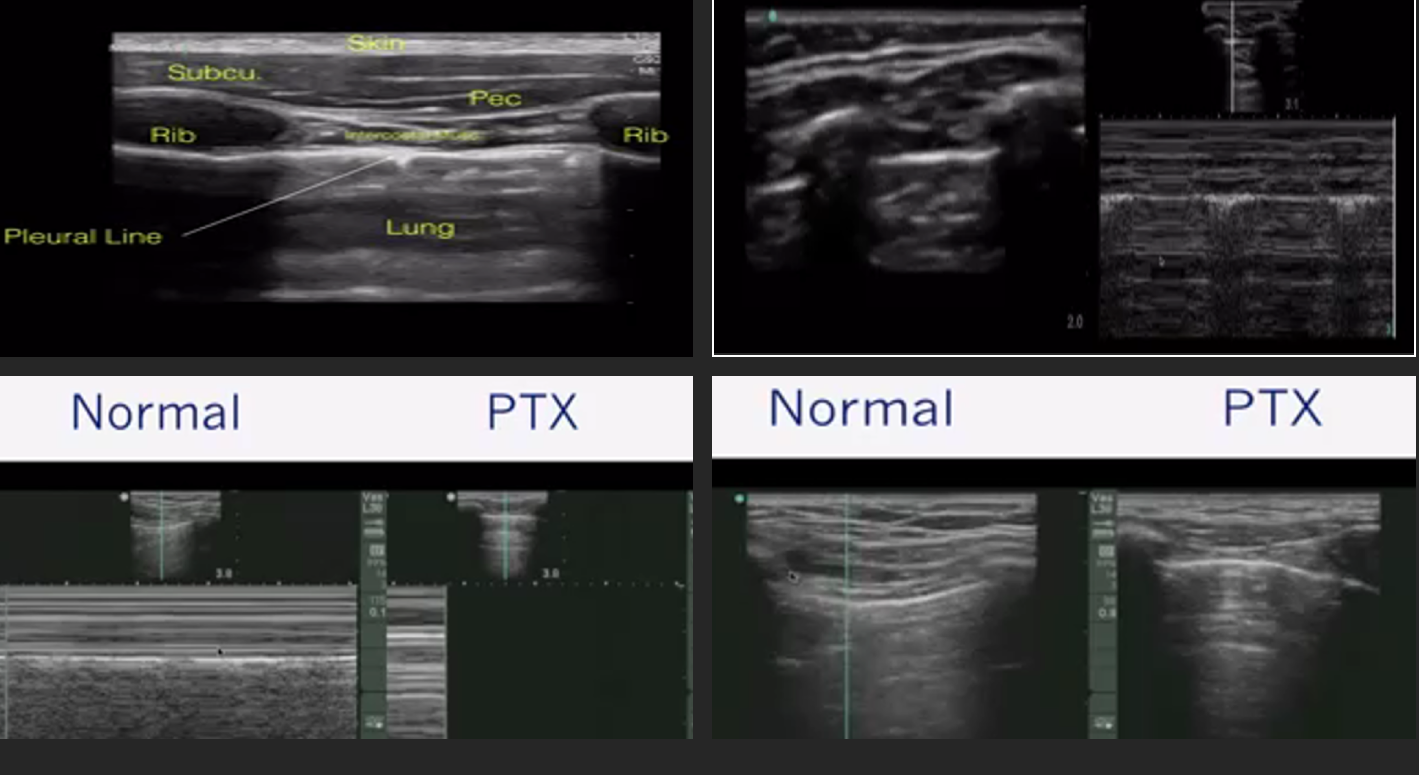
Scanning Protocol & Normal Artefacts
| Zone approach | Probe & depth | Key normal findings |
|---|---|---|
| 6-point (BLUE) or 12-zone supine/semi-recumbent | Linear (superficial) or curvilinear 3–5 MHz | Pleural line: smooth, ≤ 2 mm |
| Lung sliding (“ants marching”) in real time; seashore sign on M-mode | ||
| ≥ 2 equally spaced A-lines under each pleural line |
- A-lines = horizontal reverberations → normal aeration.
- B-lines = vertical, laser-like artefacts starting at pleura, obliterate A-lines, move with respiration
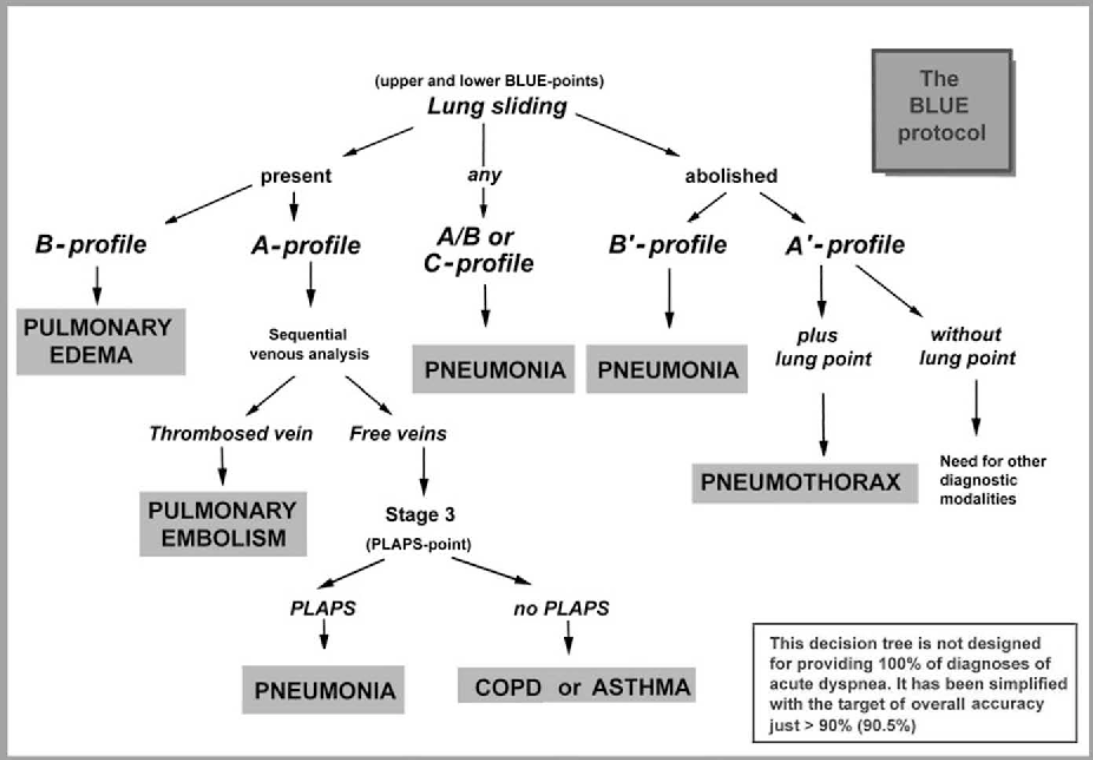
Key Pathological Signs & Diagnoses
| Pattern / sign | Diagnostic implication | Typical probe position |
|---|---|---|
| Absent lung sliding ± barcode sign | Pneumothorax (PTX) if coupled with A-lines and lung point | 2nd ICS mid-clavicular; sweep laterally |
| Multiple (≥ 3) B-lines per rib space | Interstitial syndrome (pulmonary oedema, ARDS, fibrosis, early COVID-19) | Anterior & lateral chest |
| Waterfall B-lines, spared areas | Cardiogenic oedema (diffuse) vs ARDS (patchy) | Whole hemithorax |
| Sub-pleural consolidation ± dynamic air bronchograms | Pneumonia | Posterior basal & axillary |
| Shred sign (irregular deep border) | Non-translobar pneumonia or contusion | Dependent zones |
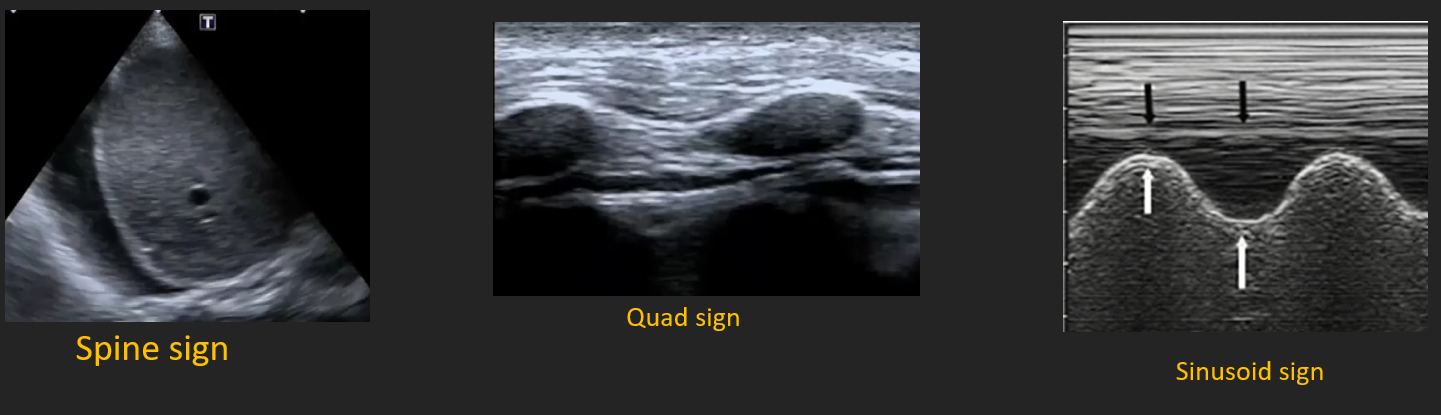
| Quad sign, spine sign, sinusoid sign | Pleural effusion | Posterolateral 5–8 ICS |
| Hepatisation + static air bronchograms | Atelectasis | Posteromedial |
| Re-appearance of pleural sliding with compression | Lung herniation / minimal PTX | Event site |
Pneumothorax (BLUE Profile A′)
- Probe: high-frequency linear.
- Hallmark: A-lines + absent sliding + lung point (specificity 99 %).
- M-mode: barcode / stratosphere sign (no granular pattern).
- Quantification: distance from sternum to lung point correlates with PTX size.
Pleural Effusion
- Curvilinear probe mid-axillary 5–7 ICS.
- Anechoic or complex collection deep to parietal pleura.
- Spine sign–vertebral bodies visualised above diaphragm.
- Quad sign (rib shadows, pleura, lung line) confirms pocket.
- Volume estimate (supine): craniocaudal height (cm) × 20 ≈ mL.
Pneumonia / Consolidation
- Patchy B-lines early → shred sign as air bronchograms appear.
- Dynamic air bronchograms distinguish pneumonia from atelectasis.
- Sensitivity ~90 %; superior to CXR for ventilator-acquired pneumonia.
Cardiogenic Pulmonary Oedema
- Bilateral, symmetrical B-lines from bases to apices (“white lung”).
- LUS score (0–3 per zone) correlates with EVLW; fall of ≥ 5 points after diuretic predicts successful wean.
Pulmonary Embolism (PE) Adjunct
- Peripheral wedge-shaped pleural-based consolidation without colour flow (dual-image Doppler).
- Combine with RV strain on echo for bedside PE probability.
Interpretation Pitfalls
- Absent B-lines does not exclude early interstitial oedema if high PEEP.
- Lung pulse (cardiac-synchronised pleural movement) rules out PTX despite absent sliding.
- Rib shadows and mirror artefact can mimic effusion—scan in two orthogonal planes.
Clinical Integration & South-African Context
- LUS halves time-to-diagnosis of PTX and pleural effusion in trauma compared with chest X-ray (UCT trauma service 2022).
- In SARS-CoV-2 waves, SAICU LUS protocol (12-zone score > 15) predicted need for invasive ventilation (AUROC 0.89).
- Recommended training: 25 supervised scans, of which ≥ 5 pathological, for independent practice (SASA POCUS 2023).

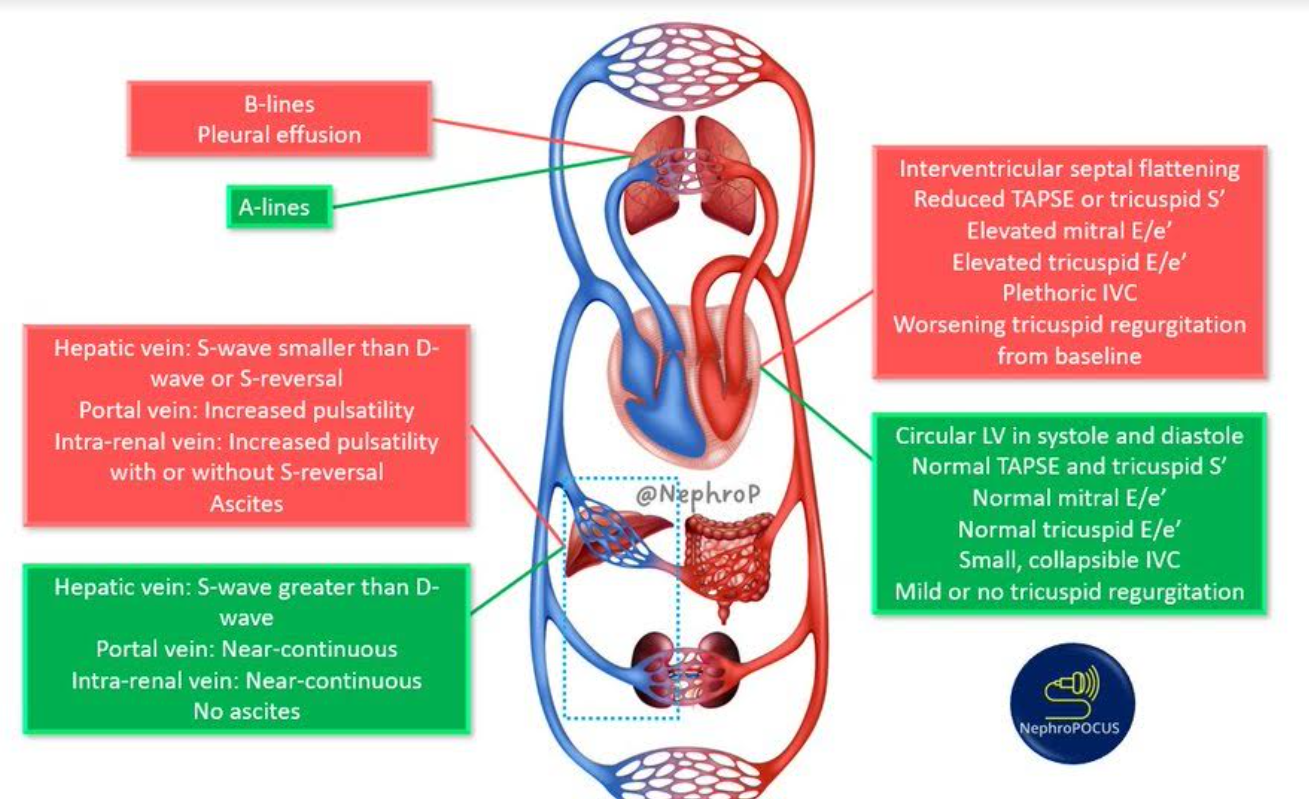
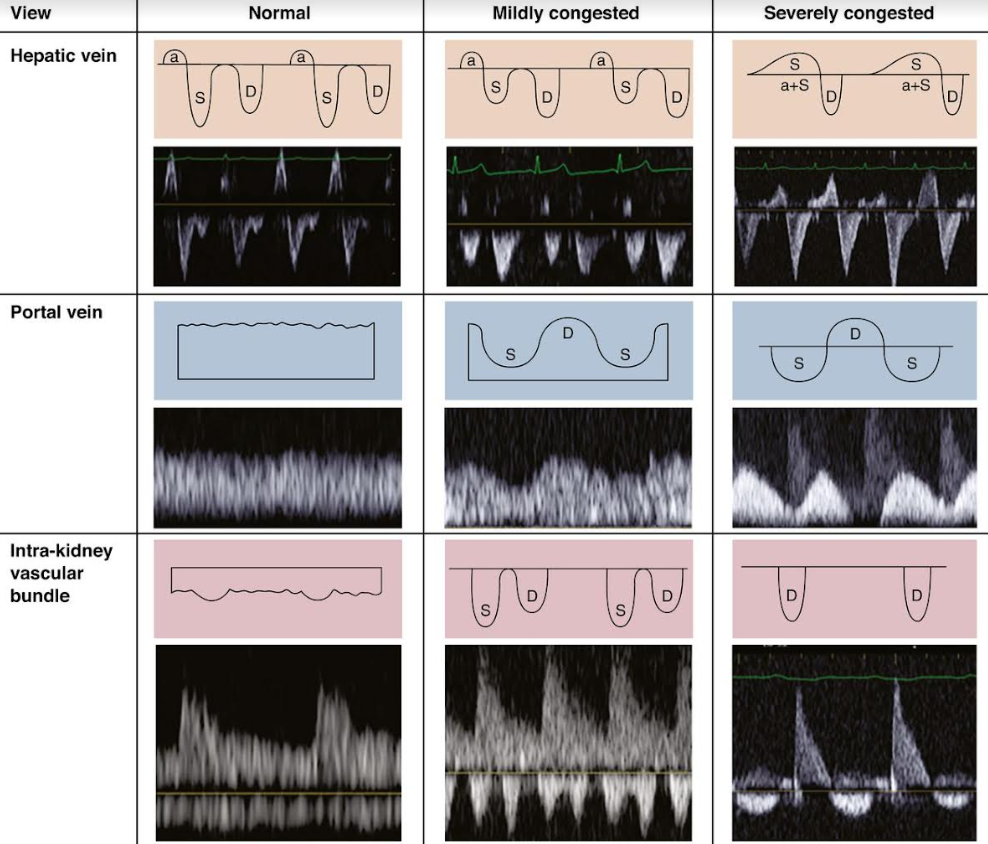
VEXUS
Links
References:
- Raj, T. D. (2017). Data interpretation in anesthesia.. https://doi.org/10.1007/978-3-319-55862-2
- Paulus WJ, Tschöpe C, Sanderson JE, Rusconi C, Flachskampf FA, Rademakers FE, Marino P, Smiseth OA, De Keulenaer G, Leite-Moreira AF, Borbély A, Edes I, Handoko ML, Heymans S, Pezzali N, Pieske B, Dickstein K, Fraser AG, Brutsaert DL. How to diagnose diastolic heart failure: a consensus statement on the diagnosis of heart failure with normal left ventricular ejection fraction by the Heart Failure and Echocardiography Associations of the European Society of Cardiology. Eur Heart J 2007;28:2539–50
- Wilkinson, J. (n.d.). Critical Care Northampton. Retrieved November 10, 2024, from [https://criticalcarenorthampton.com/
- POCUS 101. (n.d.). POCUS 101: Point of Care Ultrasound Learning Made Easy. Retrieved November 10, 2024, from https://www.pocus101.com/
- Koratala, A. (n.d.). NephroPOCUS: Nephrology Oriented Point of Care Ultrasonography. Retrieved November 10, 2024, from https://nephropocus.com/
- USabcd. (n.d.). The FATE card–a pocket guide to the cardiac views. Retrieved November 10, 2024, from https://usabcd.org/fate-card/
- Whittington JR, Thomas R. Ultrasound physics for the anaesthetist. Br J Anaesth 2024;133:820-832. Available from: https://bjanaesthesia.org
- Chin KJ, Pawa A, Chan VW. Ultrasound-guided regional anaesthesia: a review of evidence 2018–24. Curr Opin Anaesthesiol 2025;38:98-107. Available from: https://journals.lww.com
- Arzola C, Davies S. Educational requirements for peri-operative POCUS. Anesthesiology 2023;139:112-129. Available from: https://pubs.asahq.org
- South African Society of Anaesthesiologists. POCUS Framework for Anaesthesia and Critical Care 2023. Available from: https://sasaweb.com
- Royal College of Anaesthetists. Guidelines for the Provision of Regional Anaesthesia Services 2024. Available from: https://rcoa.ac.uk
- Shiloh AL, Eisen LA. Ultrasound guidance for central-venous catheter insertion: meta-analysis of controlled trials. Crit Care Med 2020;48:e1134-e1142. Available from: https://journals.lww.com
- MacGregor D, Scribante J, Perrie H, et al. ICU Echo SA: Early haemodynamic POCUS and clinical outcomes–a multicentre observational study. South Afr J Anaesth Analg 2024;30:155-162. Available from: https://sajaa.co.za
- Canty DJ, Royse A, Kilpatrick D. Intra-operative TEE in non-cardiac surgery: stepped-wedge cluster RCT. Anesth Analg 2023;137:45-54. Available from: https://journals.lww.com
- Hsu LJ, Patel PA, Singh S. Continuous-wave Doppler for aortic stenosis assessment: accuracy and pitfalls. J Am Soc Echocardiogr 2022;35:515-528. Available from: https://onlinejase.com
- Klocke R, Ryan S. Contrast-enhanced ultrasound: principles and peri-operative use. Anaesthesia 2021;76:1025-1036. Available from: https://onlinelibrary.wiley.com
- Jensen MB, Sloth E, Larsen KM, Schmidt MB. Transthoracic echocardiography for cardiopulmonary monitoring in intensive care. Eur J Anaesthesiol 2004;21:700–7 3. Frederiksen CA, Juhl-Olsen P, Larsen UT, Nielsen DG, Eika B, Sloth E. New pocket echocardiography device is interchangeable with high-end portable system when performed by experienced examiners. Acta Anaesthesiol Scand 2010;54:1217–23
- Jakobsen CJ, Torp P, Sloth E. Perioperative feasibility of imaging the heart and pleura in patients with aortic stenosis undergoing aortic valve replacement. Eur J Anaesthesiol 2007;24:589–95
- Frederiksen CA, Knudsen L, Juhl-Olsen P, Sloth E. Focusassessed transthoracic echocardiography in the sitting position: two life-saving cases. Acta Anaesthesiol Scand 2011;55:126–9
- Canty DJ, Royse CF, Kilpatrick D, Bowman L, Royse AG. The impact of focused transthoracic echocardiography in the preoperative clinic. Anaesthesia 2012;67:618–25
- Canty DJ, Royse CF, Kilpatrick D, Williams DL, Royse AG. The impact of pre-operative focused transthoracic echocardiography in emergency non-cardiac surgery patients with known or risk of cardiac disease. Anaesthesia 2012;67:714–20
- Das K, Sen J, Borode AS. Application of Echocardiography in Anaesthesia: From Preoperative Risk Assessment to Postoperative Care. Cureus. 2024 Sep 16;16(9):e69559. doi: 10.7759/cureus.69559. PMID: 39421080; PMCID: PMC11486484.
- Nagueh SF, Smiseth OA, Appleton CP, et al. Recommendations for the evaluation of left-ventricular diastolic function by echocardiography—update 2016. Eur Heart J Cardiovasc Imaging 2016;17:1321-1360.
- Stout KK, O’Leary JM, Daniels CJ, et al. 2024 focused update on diastolic function for peri-operative care. Anesthesiology 2024;140:456-475.
- Geyer MA, Scribante J, Perrie H, et al. Validation of simplified echocardiographic criteria for LV diastolic dysfunction in South-African surgical ICU patients. South Afr J Anaesth Analg 2023;29:192-199.
- Monge García MI, Saludes Orduña P, Cecconi M. Diastolic function and fluid responsiveness: systematic review and meta-analysis. Intensive Care Med 2022;48:1873-1885.
- Volpicelli G, Elbarbary M, Blaivas M, et al. International evidence-based recommendations for point-of-care lung ultrasound. Intensive Care Med 2018;44:1226-1236.
- Shokoohi H, Boniface KS, Zaragoza M, et al. Point-of-care ultrasound leads to rapid changes in management of acutely dyspnoeic patients. Ann Emerg Med 2019;74:575-586.
- Lichtenstein DA, Mezière GA. The BLUE-protocol in venous thromboembolism. Chest 2019;155:1033-1040
- Zanobetti M, Scorpiniti M, Gigli C, et al. Lung ultrasound for early diagnosis of interstitial syndrome in the ED. Chest 2021;159:933-942.
- Scribante J, Perrie H, Korda B. Accuracy of lung ultrasound for traumatic pneumothorax in a South-African level-1 trauma centre. S Afr Med J 2022;112:653-659.
- Illanes S, Naidoo M, Diedericks J. Twelve-zone lung ultrasound score predicts intubation in South-African COVID-19 ICU cohort. South Afr J Crit Care 2023;39:34-41.
- South African Society of Anaesthesiologists. POCUS Lung Module Competency Document 2023.
- Monastesse A, Girard F, Massicotte N, et al. Diagnostic accuracy of lung ultrasound after cardiac surgery. Anesth Analg 2024;139:283-292.
Summaries:
Copyright
© 2025 Francois Uys. All Rights Reserved.
id: “e7bcbf44-1b90-484f-bf40-f56693e77dc8”