{}
ECG Basics
The Cardiac Conduction System
Electrical impulses travel through the heart via a specific conduction pathway. The sinoatrial node (SAN) acts as the initial pacemaker before the impulse spreads throughout the atria and towards the atrioventricular node (AVN). The depolarisation wave travels through the heart’s septum via the Bundle of His and Purkinje fibres. These are organised into the left and right bundle branches. The right bundle branch depolarises the right ventricle, and the left bundle branch depolarises the left ventricle simultaneously. The septum is depolarised by the left bundle branch, resulting in the septum being depolarised from left to right.
The Sinoatrial Node (SAN)
- The SAN is a group of cells found high up in the right atrium close to its junction with the superior vena cava.
- The SAN functions as the heart’s intrinsic pacemaker, regulating heart rate.
- The SAN spontaneously generates electrical impulses which are transmitted to the right and left atrium.
- These electrical impulses stimulate the atrial myocardium to contract.
- Atrial muscle conducts relatively fast (0.5 m/sec).
Atrioventricular Node (AVN)
- The AVN is a group of specialised cells situated in the atrioventricular septum just above the coronary sinus ostium.
- The AVN receives electrical impulses from the atria and then transmits the electrical impulse from the atria to the ventricles.
- The AVN has a slower conduction velocity (0.05 m/sec) than the atria, allowing maximal ventricular filling prior to contraction.
The Bundle of His
- The Bundle of His is a collection of heart muscle cells specialised for electrical conduction. These cells receive input from the AVN.
- The Bundle of His branches into the left and right bundle branches which travel down the interventricular septum.
- Branches of the Bundle of His propagate impulses to the left and right ventricles respectively.
- Each branch terminates as several Purkinje fibres.
Purkinje Fibres
- Purkinje fibres are situated in the subendocardium.
- They transmit the wave of electricity to the ventricular myocardium.
- This wave of electricity results in ventricular contraction.
Normal Cardiac Conduction
- The sinoatrial node acts as the initial pacemaker.
- Depolarisation reaches the atrioventricular node.
- Impulses travel simultaneously down the Bundle of His via the left and right bundle branches. The septum is depolarised from the left.
- Both the left and right ventricular walls are depolarised simultaneously.
ECG Basics
The ECG is a graphical representation of the net direction of electrical depolarisation in the heart at any one time. Different leads look at the heart from different angles; the most important to know for understanding bundle branch blocks is that V1 views the heart from the right and V6 from the left. An upwards spike means the net depolarisation is heading towards that lead. A downward spike means the net depolarisation is heading away from that lead. There is a greater muscle mass on the left side of the heart compared to the right, so depolarisation within the left ventricles has a greater impact on the ECG trace.
The right and left ventricles should depolarise simultaneously, producing one uniform R wave. Ventricular depolarisation using normal pathways is complete within 120 ms. Depolarisation takes longer when these pathways are disrupted or changed in any way, causing broad QRS complexes. A broad QRS complex always indicates abnormal ventricular depolarisation.
For more information on ECG interpretation, see the Geeky Medics guides to reading an ECG and understanding an ECG.
ECG Interpretation
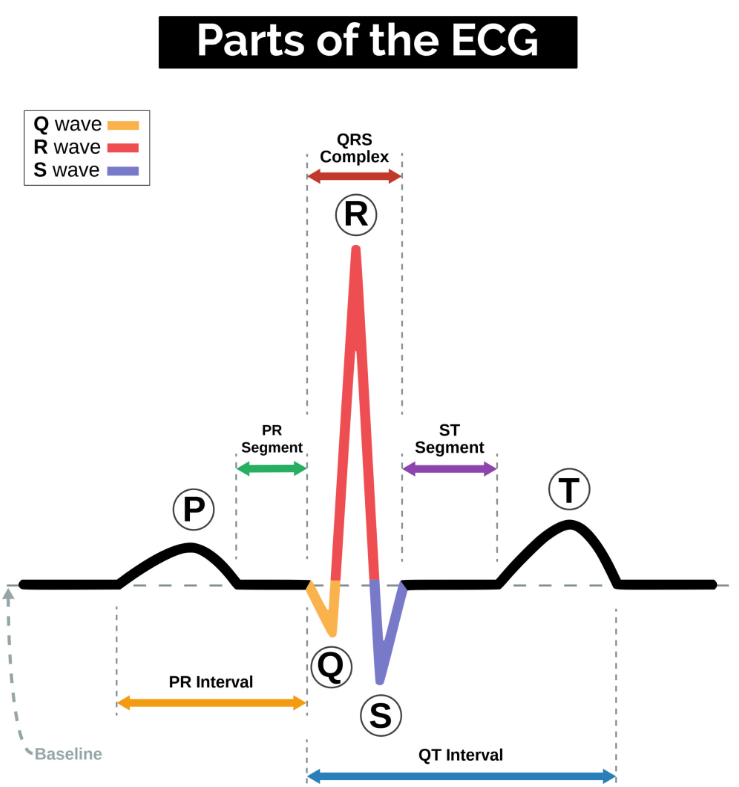
P Waves
P waves represent atrial depolarisation. In healthy individuals, there should be a P wave preceding each QRS complex.
PR Interval
The PR interval begins at the start of the P wave and ends at the beginning of the Q wave. It represents the time for electrical activity to move between the atria and the ventricles.
QRS Complex
The QRS complex represents the depolarisation of the ventricles. It appears as three closely related waves on the ECG: the Q, R, and S waves.
ST Segment
The ST segment starts at the end of the S wave and ends at the beginning of the T wave. The ST segment is an isoelectric line representing the time between depolarisation and repolarisation of the ventricles (i.e., ventricular contraction).
T Wave
The T wave represents ventricular repolarisation. It appears as a small wave after the QRS complex.
RR Interval
The RR interval begins at the peak of one R wave and ends at the peak of the next R wave. It represents the time between two QRS complexes.
QT Interval
The QT interval begins at the start of the QRS complex and finishes at the end of the T wave. It represents the time taken for the ventricles to depolarise and then repolarise.
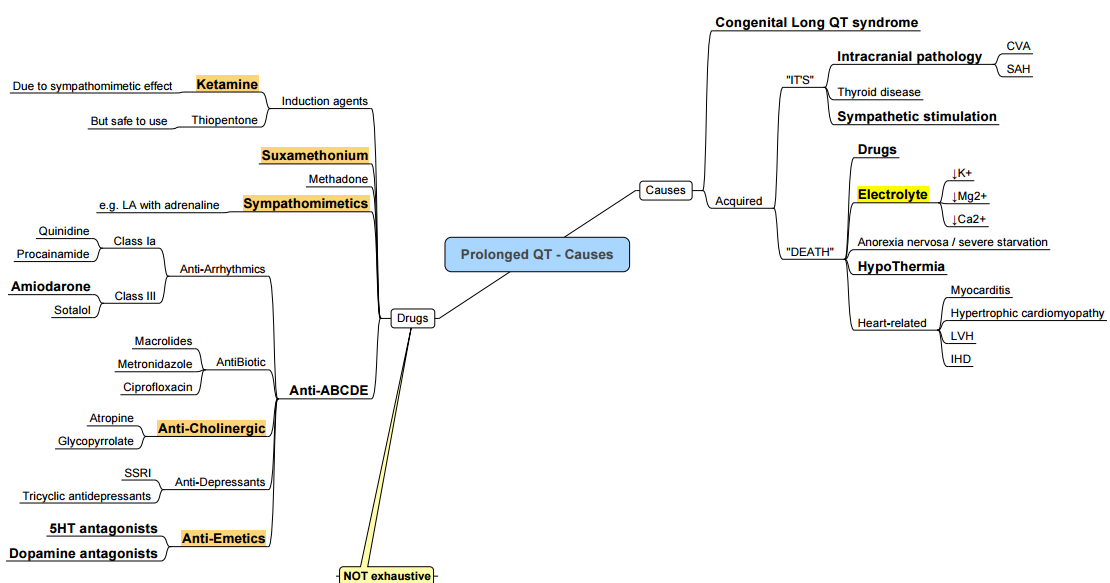
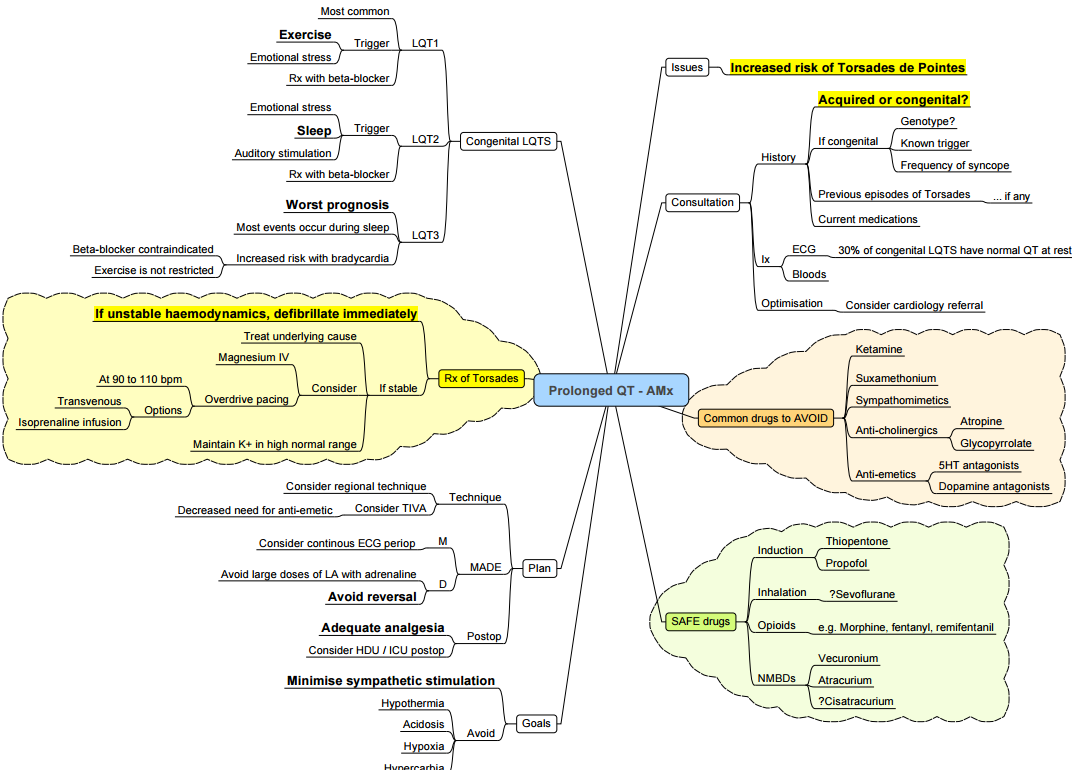
Prolonged QT
Causes
Management
Confirm Details
Before beginning ECG interpretation, confirm the following:
- Name and date of birth of the patient match the details on the ECG.
- Date and time that the ECG was performed.
- Calibration of the ECG (usually 25mm/s and 10mm/1mV).
Heart Rate
Normal Adult Heart Rate
- Normal: 60-100 bpm
- Tachycardia: > 100 bpm
- Bradycardia: < 60 bpm
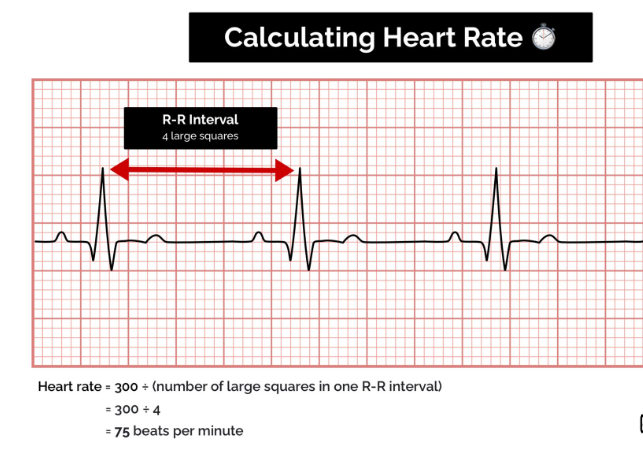
Regular Heart Rhythm
For a patient with a regular heart rhythm, the heart rate can be calculated using the following method:
- Count the number of large squares within one R-R interval.
- Divide 300 by this number to calculate the heart rate.
Heart Rate Calculation Example
- 4 large squares in an R-R interval
- 300/4 = 75 beats per minute
Irregular Heart Rhythm
Heart Rate Calculation in Irregular Rhythm
For patients with an irregular heart rhythm, the R-R interval varies significantly, requiring a different method for heart rate calculation:
- Count the number of complexes on a 10-second rhythm strip.
- Multiply the number of complexes by 6 to get the average number of beats per minute.
Heart Rate Calculation Example
- 10 complexes on a rhythm strip: (10 \times 6 = 60) beats per minute
Heart Rhythm
Heart rhythms can be regular or irregular.
Types of Irregular Rhythms
- Regularly Irregular: A recurrent pattern of irregularity.
- Irregularly Irregular: Completely disorganized pattern.
To assess irregular rhythms:
- Mark out several consecutive R-R intervals on a piece of paper.
- Move the marked intervals along the rhythm strip to check if subsequent intervals match.
Hint for AV Block
If an atrioventricular (AV) block is suspected:
- Map out the atrial rate and ventricular rhythm separately.
- Mark the P waves and R waves.
- As you move along the rhythm strip, observe if the PR interval changes, if QRS complexes are missing, or if there is complete dissociation between atrial and ventricular rhythms.
Cardiac Axis
The cardiac axis represents the overall direction of electrical activity spreading through the cardiac conduction system. It indicates the net effect of all action potentials generated within the heart.
Interpreting Cardiac Axis on ECG
- Positive Deflection: When electrical activity is directed towards an ECG lead.
- Negative Deflection: When electrical activity is directed away from an ECG lead.
Normal Cardiac Axis
In healthy individuals, the cardiac axis typically lies between -30° (aVL) and +90º (aVF).
- The net electrical activity spreads towards leads I, II, and III.
- Lead II shows the most positive deflection as it is most aligned with the overall direction of electrical spread.
- The most negative deflection is seen in aVR, which views the heart in the opposite direction.
Typical ECG Findings for Normal Cardiac Axis
- Lead II: Most positive deflection compared to leads I and III.
Right Axis Deviation (RAD)
Right axis deviation involves the direction of depolarization being distorted to the right (between +90º and +180º).
- Common cause: Right ventricular hypertrophy.
- RAD is associated with conditions like pulmonary hypertension and can be a normal finding in very tall individuals.
Typical ECG Findings for RAD
- Lead III: Most positive deflection.
- Lead I: Negative deflection.
- Associated with right ventricular hypertrophy.
Left Axis Deviation (LAD)
Left axis deviation involves the direction of depolarization being distorted to the left (between -30º and -90º).
- Common causes: Heart conduction abnormalities, inferior MI, LBBB, LAFB, LVH.
Typical ECG Findings for LAD
- Lead I: Most positive deflection.
- Leads II and III: Negative deflection.
P Waves
Examine P waves to answer:
- Are P waves present?
- Is each P wave followed by a QRS complex?
- Do the P waves look normal? (Check duration, direction, and shape)
- If P waves are absent, is there any atrial activity?
Types of Atrial Activity
- Sawtooth baseline: Flutter waves.
- Chaotic baseline: Fibrillation waves.
- Flat line: No atrial activity.
Hint for Atrial Fibrillation
If P waves are absent and the rhythm is irregular, it may suggest atrial fibrillation.
PR Interval
- The PR interval should be between 120-200 ms (3-5 small squares).
Prolonged PR Interval (>0.2 seconds)
- A prolonged PR interval suggests the presence of atrioventricular delay (AV block).
First-degree Heart Block (AV block)
- First-degree heart block involves a fixed prolonged PR interval (>200 ms).
Second-degree Heart Block (type 1)
Calgary-2nd degree type 01——–Pathogenesis-and-Clinical-Findings/)
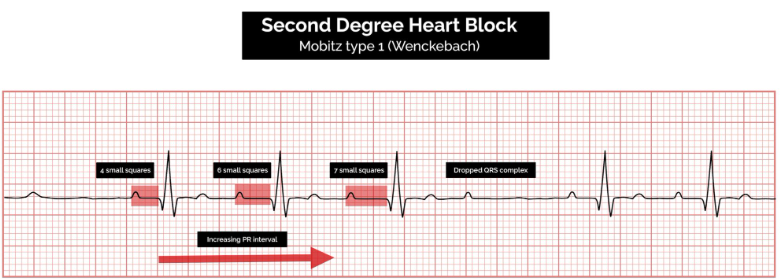
- Also known as Mobitz Type 1 AV Block or Wenckebach Phenomenon.
ECG Findings
- Progressive prolongation of the PR interval until an atrial impulse is not conducted.
- The QRS complex is dropped.
- AV nodal conduction resumes with the next beat.
- The sequence of progressive PR interval prolongation and the eventual dropping of a QRS complex repeats itself.
Second-degree Heart Block (type 2)
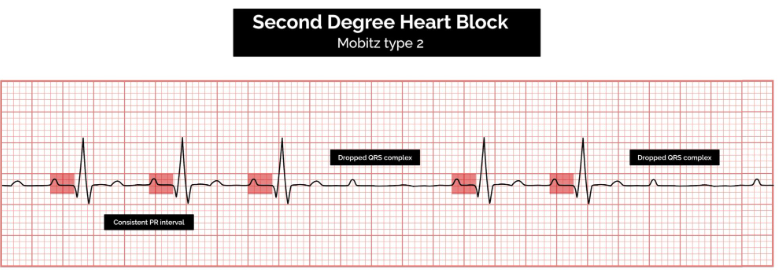
- Also known as Mobitz Type 2 AV Block.
ECG Findings
- Consistent PR interval duration.
- Intermittently dropped QRS complexes due to a failure of conduction.
- The intermittent dropping of the QRS complexes typically follows a repeating cycle:
- Every 3rd P wave (3:1 block).
- Every 4th P wave (4:1 block).
Third-degree Heart Block (complete Heart block)
Calgary-3rd degree-AV-Block—Pathogenesis-and——Clinical-Findings/)
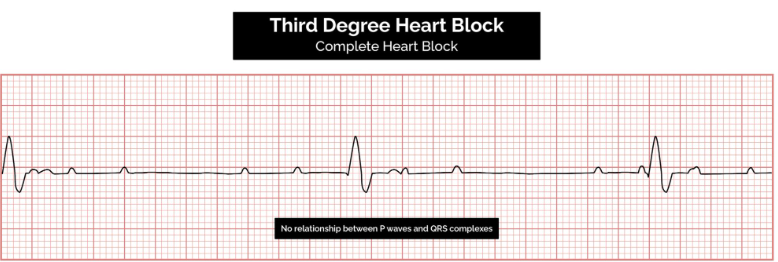
Pathophysiology
Occurs when there is no electrical communication between the atria and ventricles due to a complete failure of conduction.****
ECG Findings
- Presence of P waves and QRS complexes that have no association with each other.
- Atria and ventricles function independently.
Cardiac Function Maintenance
- Maintained by a junctional or ventricular pacemaker.
Escape Rhythms
- Narrow-complex escape rhythms (QRS complexes <0.12 seconds duration) originate above the bifurcation of the bundle of His.
- Broad-complex escape rhythms (QRS complexes >0.12 seconds duration) originate below the bifurcation of the bundle of His.
Tips for Remembering Types of Heart Block
Understanding the anatomical location of the block within the conducting system can help in remembering the various types of AV block.
First-Degree AV Block
- Location: Between the SA node and the AV node (within the atrium).
Second-Degree AV Block
- Mobitz I AV Block (Wenckebach):
- Location: In the AV node (the only conductive tissue in the heart that can conduct at different speeds).
- Mobitz II AV Block:
- Location: After the AV node in the bundle of His or Purkinje fibers.
Third-Degree AV Block
- Location: At or after the AV node, resulting in a complete blockade of distal conduction.
Shortened PR Interval
A shortened PR interval can indicate one of two scenarios:
-
Proximity to AV Node:
- The P wave originates closer to the AV node, resulting in faster conduction.
- The SA node’s location can vary, and atrial size differences can affect conduction time.
-
Accessory Pathway:
- The atrial impulse reaches the ventricle via a faster shortcut instead of the normal slow conduction across the atrial wall.
- This accessory pathway can be associated with a delta wave.
QRS Complex
When assessing a QRS complex, you need to pay attention to the following characteristics:
- Width
- Height
- Morphology
Width
The width can be described as NARROW (< 0.12 seconds) or BROAD (> 0.12 seconds):
-
Narrow QRS Complex:
- Occurs when the impulse is conducted down the bundle of His and the Purkinje fibers to the ventricles.
- Results in well-organized, synchronized ventricular depolarization.
-
Broad QRS Complex:
- Occurs if there is an abnormal depolarization sequence.
- Example: Ventricular ectopic where the impulse spreads slowly across the myocardium from the focus in the ventricle.
- An atrial ectopic would result in a narrow QRS complex because it conducts down the heart’s normal conduction system.
- Bundle Branch Block: Results in a broad QRS complex because the impulse reaches one ventricle rapidly down the intrinsic conduction system and then spreads slowly across the myocardium to the other ventricle.
Bundle Branch Block
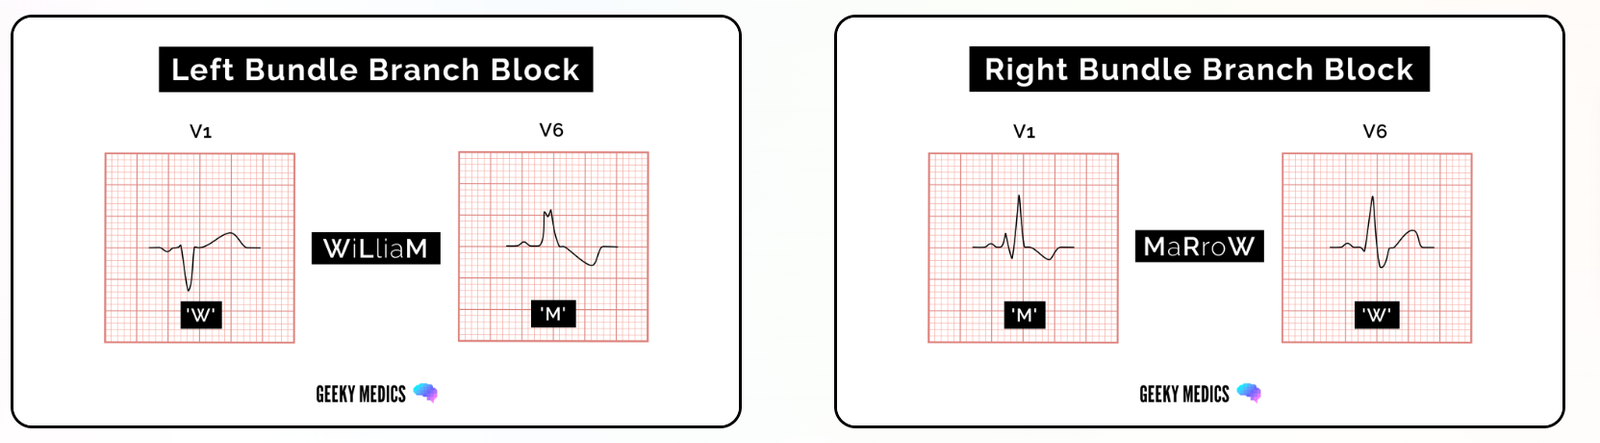
Broad QRS complexes are a hallmark feature of bundle branch block, which includes Left Bundle Branch Block (LBBB) and Right Bundle Branch Block (RBBB). The WiLLiaM MaRRoW mnemonic can be used to quickly recognize left and right bundle branch blocks by looking at V1 and V6.
- WiLLiaM (left bundle branch block): Two Ls in WiLLiaM = Left Bundle Branch Block.
- MaRRoW (right bundle branch block): Two Rs in MaRRoW = Right Bundle Branch Block.
Each name’s first and last letter helps you recognize the ECG features of the associated bundle branch block.
Right Bundle Branch Block (RBBB)
Diagnostic Criteria
The diagnostic criteria for RBBB are:
- Broad QRS complex: >120 ms (3 small squares).
- RSR’ pattern in V1-V3: an initial small upward deflection (R wave), a larger downward deflection (S wave), then another large upward deflection (second R wave, indicated as R’).
- Wide, slurred S wave in lateral leads: I, aVL, V5-V6.
Pathophysiology
In right bundle branch block:
- The sinoatrial node acts as the initial pacemaker.
- Depolarization reaches the atrioventricular node.
- Depolarization through the bundle of His occurs only via the left bundle branch. The left branch still depolarizes the septum as normal.
- The left ventricular wall depolarizes as normal.
- The right ventricular walls are eventually depolarized by the left bundle branch via a slower, less efficient pathway.
Clinical Relevance
RBBB can be either physiological or the result of damage to the right bundle branch. Causes of damage include underlying lung pathology (COPD, pulmonary emboli, cor pulmonale), primary heart muscle disease (ARVC), congenital heart disease (e.g., ASD), ischemic heart disease, and primary degeneration of the right bundle.
WiLLiaM MaRRoW Mnemonic
The WiLLiaM MaRRoW mnemonic can be used to quickly recognize left and right bundle branch blocks by looking at V1 and V6:
- WiLLiaM refers to the ECG appearance of left bundle branch block.
- MaRRoW refers to the ECG appearance of right bundle branch block.
To recognize right bundle branch block, use the name MaRRoW and look at the first and last letters:
- M: Complexes in V1 resemble the letter M: initial small upward deflection (r wave), a larger downward deflection (S wave), then another large upward deflection (second R wave).
- W: Complexes in V6 resemble a W: initial small downward deflection (Q wave), then a larger upward deflection (R wave), and then a wide downward deflection (S wave).
Left Bundle Branch Block (LBBB)
Diagnostic Criteria
The diagnostic criteria for LBBB are:
- Broad QRS complex: >120 ms (3 small squares)
- Dominant S wave in V1
- Broad, monophasic R wave in lateral leads: I, aVL, V5-V6
- Absence of Q waves in lateral leads
- Prolonged R wave >60 ms in leads V5-V6
WiLLiaM MaRRoW Mnemonic
The WiLLiaM MaRRoW mnemonic can be used to quickly recognize left and right bundle branch blocks by looking at V1 and V6.
To recognize left bundle branch block, use the name WiLLiaM and look at the first and last letters:
- W: Complexes in V1 resemble the letter W: deep downward deflection (dominant S wave), which may be notched.
- M: Complexes in V6 resemble the letter M: broad, notched or ‘M’ shaped R wave in V6.
Pathophysiology
When viewed from the right-hand side (V1), net depolarization travels away (towards the left), resulting in negative ECG deflections. The first downward deflection represents the right ventricle, and the slightly delayed second downward deflection corresponds to the depolarization of the left ventricle.
When viewed from the left-hand side (V6), where the net depolarization is traveling towards the detector, deflections are positive on the ECG. There will be two peaks (RR) due to the delay in left ventricular depolarization.
In left bundle branch block:
- The sinoatrial node acts as the initial pacemaker.
- Depolarization reaches the atrioventricular node.
- Depolarization down the bundle of His occurs only via the right bundle branch. The septum is abnormally depolarized from right to left.
- The right ventricular wall is depolarized as normal.
- The left ventricular walls are eventually depolarized by the right bundle branch via a slower, less efficient pathway.
Branches of the Left Bundle Branch
Due to the relatively greater mass of the left ventricle, disruptions in the depolarization of the left ventricular muscle can cause cardiac axis changes. The left bundle branch splits into anterior and posterior fascicles.
- LBBB = Left anterior fascicular block (LAFB) + Left posterior fascicular block (LPFB)
Each branch of the left bundle branch may be damaged in isolation. Anterior fascicle block, which is much more common, causes left axis deviation. Posterior fascicle block may cause right axis deviation. However, the posterior fascicle does much less work than the anterior fascicle, so it can be blocked without any obvious ECG changes.
The right ventricular muscle does not have enough mass to significantly deviate the cardiac axis.
Other Types of Block
- Bifascicular Block: Involves both right bundle branch block and the blockade of one of the fascicles of the left bundle branch.
- Trifascicular Block: Present when a 3rd-degree heart block exists alongside bifascicular block.
Height of QRS Complex
- Small Complexes: Defined as < 5 mm in the limb leads or < 10 mm in the chest leads.
- Tall Complexes: Imply ventricular hypertrophy (although can be due to body habitus, e.g., tall, slim people). There are numerous algorithms for measuring LVH, such as the Sokolow-Lyon index or the Cornell index.
Morphology
To assess morphology, evaluate the individual waves of the QRS complex.
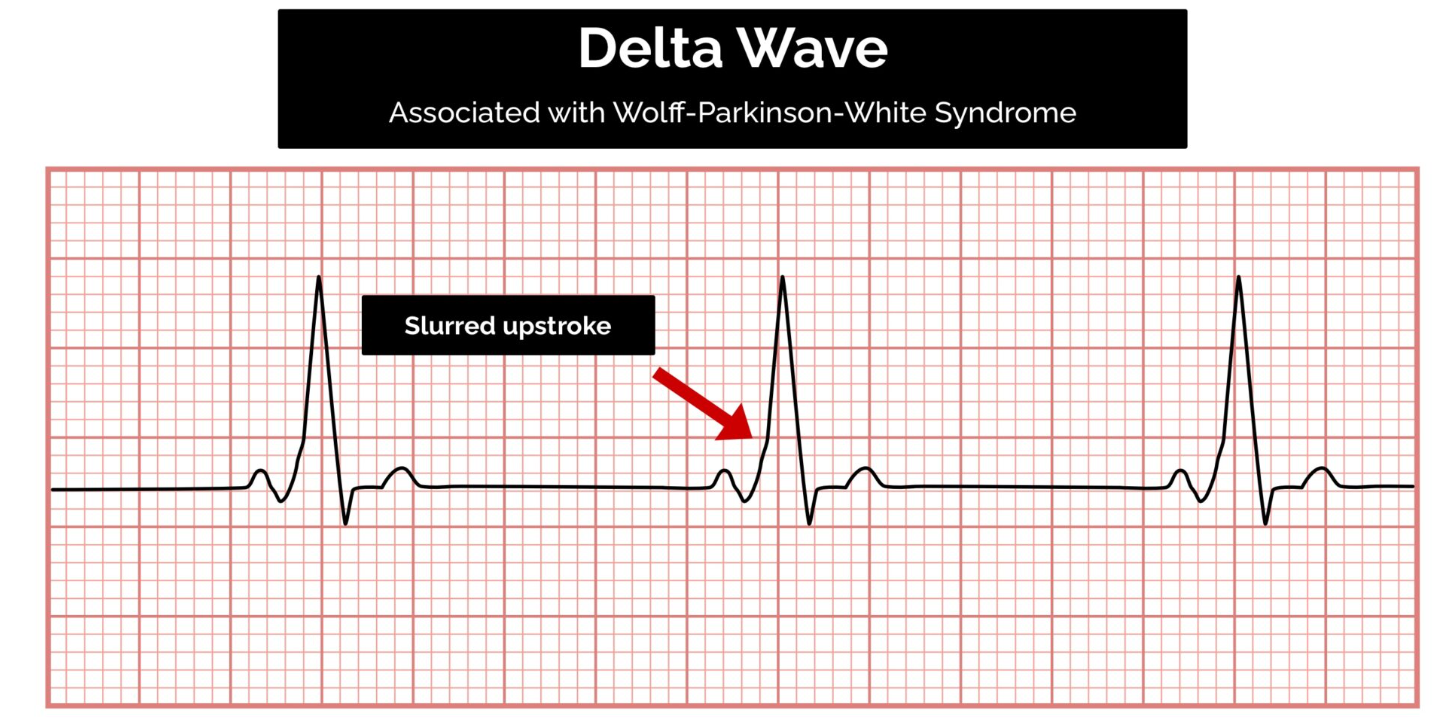
Delta Wave
The mythical ‘delta wave’ indicates that the ventricles are being activated earlier than normal from a point distant from the AV node. The early activation then spreads slowly across the myocardium, causing the QRS complex’s slurred upstroke.
The presence of a delta wave does NOT diagnose Wolff-Parkinson-White syndrome. This requires evidence of tachyarrhythmias AND a delta wave.
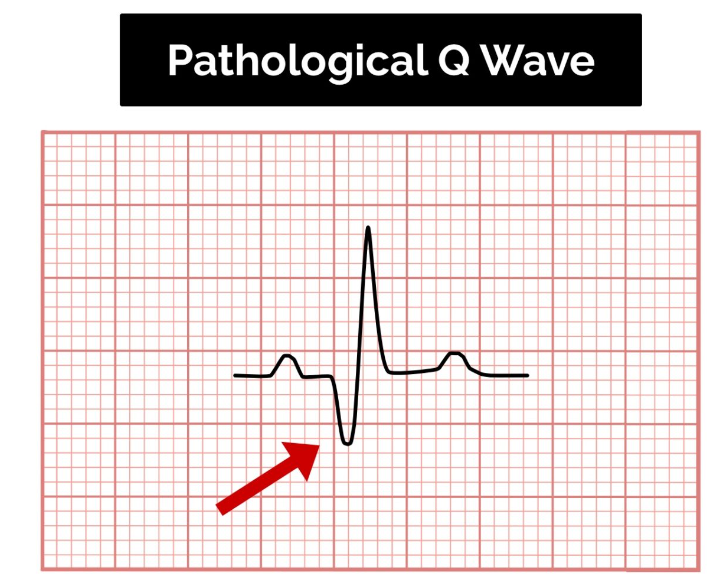
Q-waves
Normal vs. Pathological Q-waves
- Isolated Q waves can be normal.
- A pathological Q wave is defined as:
-
25% the size of the R wave that follows it.
-
2 mm in height and > 40 ms in width.
-
A single Q wave is not a cause for concern. Look for Q waves in an entire territory (e.g., anterior/inferior) to assess for evidence of a previous myocardial infarction.
R and S Waves
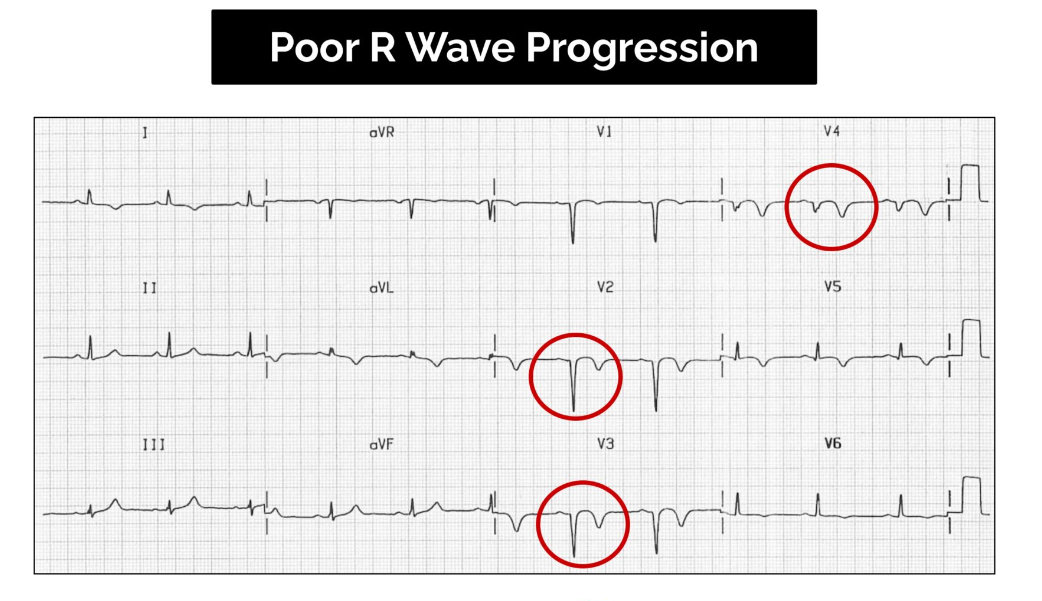
Assess the R wave progression across the chest leads (from small in V1 to large in V6). The transition from S > R wave to R > S wave should occur in V3 or V4.
- Poor progression (i.e., S > R through to leads V5 and V6) can be a sign of previous MI but can also occur in very large individuals due to poor lead position.
Dominant R Wave
- Dominant R wave in V1:
- RBBB
- RVH
- Posterior MI
- Normal in children
- Dextrocardia
- Dominant R wave in aVR:
- Poisoning with sodium-channel blocking drugs
- Dextrocardia
- Incorrect lead placement:
- Lead I becomes inverted
- Leads aVR and aVL switch places
- Leads II and III switch places
- Commonly elevated in ventricular tachycardia
J Point Segment
The J point is where the S wave joins the ST segment. This point can be elevated, resulting in the ST segment that follows it being raised (this is known as “high take-off”).
Benign Early Repolarization (High Take-Off)
- Benign early repolarization is a normal variant that causes confusion as it looks like ST elevation.
Key Points for Assessing the J Point Segment:
- Occurs mostly under the age of 50. Over the age of 50, ischemia is more common and should be suspected first.
- Typically, the J point is raised with widespread ST elevation in multiple territories, making ischemia less likely.
- The T waves are also raised (in contrast to a STEMI, where the T wave remains the same size and the ST segment is raised).
- The ECG abnormalities do not change. During a STEMI, the changes will evolve, whereas in benign early repolarization, they will remain the same.
ST Segment
The ST segment is the part of the ECG between the end of the S wave and the start of the T wave. In a healthy individual, it should be an isoelectric line (neither elevated nor depressed). Abnormalities of the ST segment should be investigated to rule out pathology.
ST-Elevation
ST-elevation is significant when it is greater than 1 mm (1 small square) in 2 or more contiguous limb leads or >2 mm in 2 or more chest leads. It is most commonly caused by acute full-thickness myocardial infarction.
ST Depression
ST depression ≥ 0.5 mm in ≥ 2 contiguous leads indicates myocardial ischemia.
T Waves
T waves represent the repolarization of the ventricles.
Tall T Waves
T waves are considered tall if they are:
-
5 mm in the limb leads AND
-
10 mm in the chest leads (the same criteria as ‘small’ QRS complexes).
Tall T waves can be associated with:
- Hyperkalemia (“tall tented T waves”)
- Hyperacute STEMI
Inverted T Waves
T waves are normally inverted in V1, and inversion in lead III is a normal variant. Inverted T waves in other leads are a nonspecific sign of a wide variety of conditions:
- Ischemia
- Bundle branch blocks (V4-6 in LBBB and V1-V3 in RBBB)
- Pulmonary embolism
- Left ventricular hypertrophy (in the lateral leads)
- Hypertrophic cardiomyopathy (widespread)
- General illness
Around 50% of patients admitted to ITU have some evidence of T wave inversion during their stay. Observe the distribution of the T wave inversion (e.g., anterior/lateral/posterior leads). You must take this ECG finding and apply it in the clinical context of your patient.
Biphasic T Waves
Biphasic T waves have two peaks and can indicate ischemia and hypokalemia.
Flattened T Waves
Flattened T waves are a non-specific sign that may represent ischemia or electrolyte imbalance.
U Waves
U waves are not a common finding. The U wave is a > 0.5 mm deflection after the T wave best seen in V2 or V3. These become larger the slower the bradycardia–classically U waves are seen in various electrolyte imbalances, hypothermia, and secondary to antiarrhythmic therapy (such as digoxin, procainamide, or amiodarone).
Coronary Anatomy
Coronary Arteries
Two arteries originate from the root of the aorta behind the cusps (aortic sinus) of the aortic valve. The left posterior aortic sinus gives rise to the left CA, and the anterior aortic sinus gives rise to the right CA. These arteries supply the myocardium.
- Right vs. Left Dominant Circulation: Determined by the artery that gives rise to the posterior descending artery.
- In 70% of hearts, it is the RCA.
- 20% of hearts are co-dominant.
- 10% are left-dominant.
Right Coronary Artery (RCA)
- Supplies:
- Right atrium, right ventricle, SA and AV nodes
- ECG Changes:
- Inferior MI: Leads II, III, aVF
- Can cause bradycardia and heart blocks (SA and AV node problems).
- Inferior MI: Leads II, III, aVF
Posterior Descending Artery
- Supplies:
- Right ventricle, posterior left ventricle
- ECG Changes:
- Posterior MI: Leads V1-V4 (Since this is posterior, evidence of STEMI will be depression)
Left Coronary Artery (LCA)
- Branches:
- Left Main Artery
Left Circumflex Artery
- Supplies:
- Lateral left ventricle and left atrium
- ECG Changes:
- Anterolateral MI: Leads I, aVL, V3-V6
Left Anterior Descending Artery
- Supplies:
- Septum, anterior left ventricle, apex of the left ventricle
- ECG Changes:
- Anteroseptal MI (septal branch occlusion): Leads V1-V3
Left Main Artery
- Supplies:
- Virtually entire left ventricle, including septum +/- some of the right ventricle
- ECG Changes:
- Difficult to determine, can have changes in all leads.
ECG Changes Based on Degree of Occlusion
-
STEMI:
- ST segment elevation at least 2 mm (little squares) in precordial leads V1-V6 or 1 mm in the limb leads (all other leads).
- Indicates total occlusion of the artery supplying the affected area and transmural ischemia.
- Reciprocal changes in opposite leads present as ST depression.
-
Non-STEMI:
- Can present as ST segment depression or T wave flattening or inversion.
- Indicates severe blockage but not complete occlusion of an artery or transmural ischemia.
Links
References:
- Geeky Medics. (n.d.). How to read an ECG. Retrieved from https://geekymedics.com/how-to-read-an-ecg/
- Becker, D. E. (2006). Fundamentals of electrocardiography interpretation. Anesthesia Progress, 53(2), 53-64. https://doi.org/10.2344/0003-3006(2006)53[53:foei]2.0.co;2
- The Calgary Guide to Understanding Disease. (2024). Retrieved June 5, 2024, from https://calgaryguide.ucalgary.ca/
- FRCA Mind Maps. (2024). Retrieved June 5, 2024, from https://www.frcamindmaps.org/
- Raj, T. D. (2017). Data interpretation in anesthesia.. https://doi.org/10.1007/978-3-319-55862-2
Summaries:
Calgary-Ant and post fascicular blocks
Copyright**
© 2025 Francois Uys. All Rights Reserved.
id: “c0ca6a8c-2c17-46e6-84bf-c82b63d532b0”