{}
Viscoelastic (TEG and ROTEM)
General TEG
How it Works
- 0.36mL of whole blood is placed into a heated cuvette (37°C) which rotates every 10 seconds at an angle of 45°
- A pin connected to a torsion wire is suspended in the sample. Initially the pin does not move.
- Once clotting takes place, the pin moves as the sample is rotated → torsion in the wire → transmitted to a mechanico-electrical transducer → generates the signal. As fibrinolysis ensues, the wire de-torts.
Advantages and Disadvantages of Fixed Ratio Massive Transfusion
Advantages
- Rapidly available (time-limited by the thawing of FFP only).
- Available almost everywhere.
- Easily protocolised, i.e., easy to order and does not divert focus from managing the trauma.
- Cost of products is the only expense; maintenance cost for the blood bank staff and equipment is not purely for support of MTPs.
- Widespread familiarity with the standard transfusion ratio.
- Does not interfere with the use of TEG (i.e., one may simply order the MTP pack while waiting for the TEG sample to cook).
Disadvantages
- Exact ratio (e.g., 1:1:1) is still a matter of debate.
- Fixed ratio of products does not account for the possibility of fibrinolysis.
- Non-diagnostic: unlike TEG, it is not an investigation of clotting function but a management protocol implemented before results are available.
TEG Guided Transfusions
Advantages and Disadvantages of TEG (Thromboelastography) Guided Transfusions
Advantages
- Rapid (10-20 min).
- Cheaper than wasting blood products.
- Conserves blood bank resources.
- Rapidly becoming more common.
- Tests fibrinolysis, which otherwise is not conveniently done.
- Individualised care: compensates for intercase variability of clotting factor consumption.
- Demonstrates that coagulopathy is fully corrected, promoting surgical management.
Disadvantages
- Not as rapid as empirical transfusion (wastes valuable minutes).
- More expensive than coags if recalibration and maintenance costs are included.
- Rare in smaller and regional centres.
- Assessment of fibrinolysis is often omitted in place of routinely giving tranexamic acid.
- Requires training to use and interpret.
- Poor precision.
- Does not account for hypothermia-induced coagulopathy.
- Does not identify warfarin or most NOACs.
- TEG-guided algorithms do not have widespread familiarity and acceptance as valid.
Limitations
- Must be processed within 3 minutes without activators for a true MA; heating will not truly reflect the haemostatics of a hypothermic patient; Even citrated samples have maximum stability between 30 and 240 min
Rationale for Heparinase in TEG
Heparinase will shorten a prolonged R-time if it was due to the effect of heparin ⇒ protamine should be given
Modifications and Interpretations
- Tissue Factor: Activator standardizing clotting process; enables rapid establishment of maximal amplitude (MA).
- R Time and Heparinase: R value sensitive to heparin and endogenous heparan sulfate; heparinase-treated samples assess heparin impact.
- Tissue Factor/Kaolin Activated TEG and ACT: Reflection of clot strength and function; strong correlation with platelet count and function.
- Fibrinogen and Platelet Function: Correlation with platelet count; aids in discriminating hypofibrinogenemia.
- Fibrinolysis: Detected by analyzing clot lysis on TEG; empirical or inappropriate anti-fibrinolytic therapy avoided.
- Hypercoagulability: Screen for hypercoagulable states; shorter R values and accelerated clot propagation noted in thromboembolic patients.
- Platelet Mapping TEG: Tests platelet function in clot formation with and without anti-platelet drugs.
ROTEM Vs TEG
ROTEM® Analysis
- Technology Description: 300 µl of whole blood with activators incubated in disposable cuvette at 37°C.
- Process: A pin rotates in the blood, encountering impedance as clot strength increases. Detected by an optical system and translated into characteristic tracing.
Interpretation
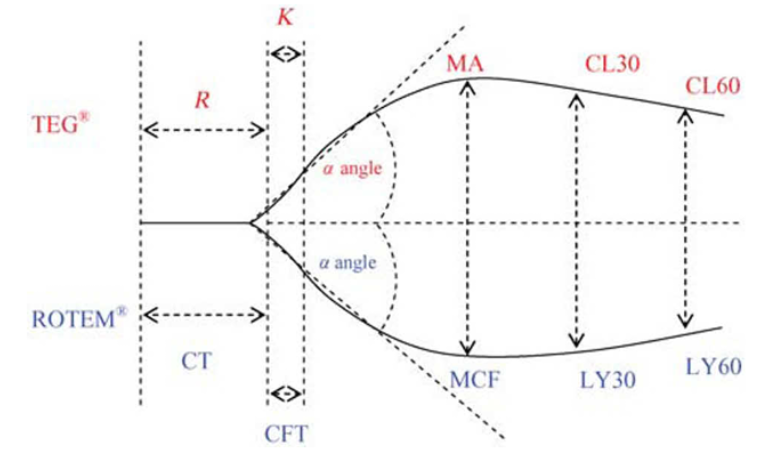
Interpretation of TEG® and ROTEM® Parameters
| Parameter (TEG®) | ROTEM® | Definition | Significance |
|---|---|---|---|
| R (reaction time) | CT (clotting time) | Time until initiation of fibrin formation, taken as a period to 2 mm amplitude on the tracing | Indicates concentration of soluble clotting factors in the plasma |
| K time | CFT (clot formation time) | Time period for the amplitude of the tracing to increase from 2 to 20 mm | Measurement of clot kinetics |
| α angle | α angle | Angle between a tangent to the tracing at 2 mm amplitude and the horizontal midline | Rapidity of fibrin build up and cross-linking |
| MA | MCF (maximum clot firmness) | Greatest vertical width achieved by the tracing reflecting maximum clot strength | Number and function of platelets and fibrinogen concentration |
| CL30 | LY30 | Percent reduction in amplitude 30 min after MA | Clot stability and fibrinolysis |
| CL60 | LY60 | Percent reduction of clot firmness 1 h after MCF | Clot stability and fibrinolysis |
Strengths and Limitations of TEG®/ROTEM®
Strengths
- Rapid assessment of coagulation status.
- Analysis of all three phases of coagulation: initiation, amplification, and propagation.
- Reduces rates of transfusion and surgical re-exploration.
- Detects hypercoagulable states in postoperative patients.
- TEG® kaolin and ROTEM® INTEM cartridges sensitive to residual heparin, aiding in detection of inadequate heparin reversal.
Limitations
- Cannot reflect endothelium contribution to coagulation.
- Poor predictors of postoperative bleeding from preoperative baseline.
- Does not reflect hypothermia effects.
- Insensitive to aspirin and clopidogrel.
- Lack of standardization in sample collection and processing.
- Concerns about adequate maintenance and quality control outside laboratory settings.
- Moderate agreement between TEG® and ROTEM® results, not interchangeable.
Pathway Activation
- INTEM: Intrinsic Pathway activation (F II, V, VIII, IX, X, XI, XII, Heparin).
- EXTEM: Extrinsic Pathway activation (F II, V, VII, X).
- FIBTEM: Fibrin activity/contribution to clot firmness (extrinsic activation, platelet neutralization).
- HEPTEM: Confirms heparin effect (intrinsic activation, heparin neutralization).
- APTEM: Confirmation of hyperfibrinolysis (extrinsic activation with antifibrinolytic agent).
Possible Combinations of Abnormal TEMograms
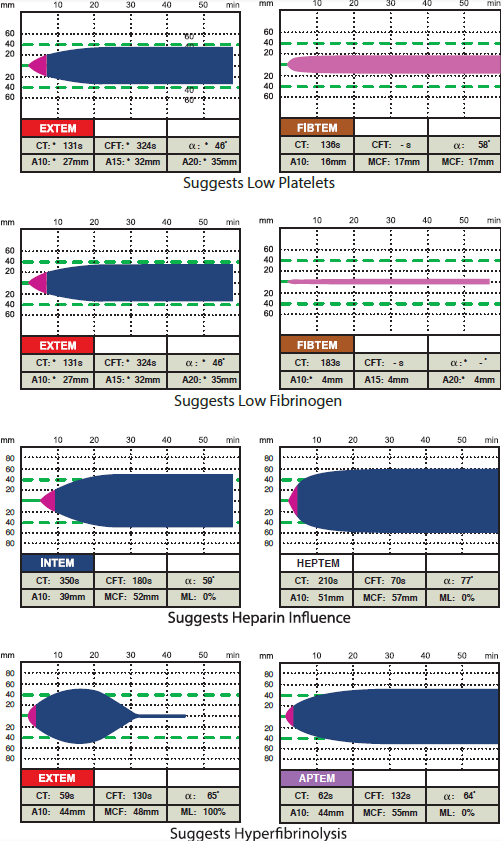
Fibtem neutralizes platelets. The others neutralize heparin and fibrinolysis respectively
All improve on the preceding test except fibtem on extem if fibrinogen is low (knock out the platelets and clotting is bad => platelets are holding the fort => fibrinogen is low)
Different Patterns
Normal TEG® Parameters
| Parameter | Definition | Units |
|---|---|---|
| R | Reaction time, first measurable clot formation | minutes |
| K | Achievement of certain clot firmness | minutes |
| Angle (α) | Kinetics of clot development | angle in degrees |
| MA | Maximum amplitude, maximum strength of clot | mm |
| CI | Coagulation index, linear combination of R, K, Angle, MA | — |
| EPL | Estimated percent lysis | % |
| LY30 | Percent lysis 30 minutes after MA | % |
Abnormal
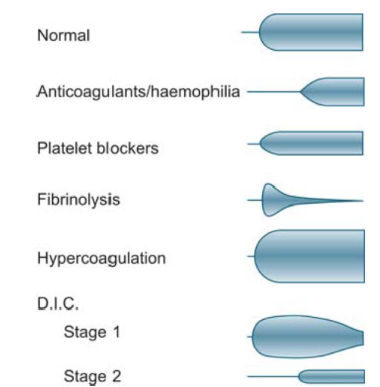
TEG Shapes and Corresponding Treatments
Shape of the TEG + Alcohol Glass = What is Needed
- Brandy Tumbler = Normal (Do Nothing)
- Champagne Flute = Give Cryo
- Red Wine Glass = Give FFP
- Martini Glass = Give TXA
- Test Tube = Give Platelets
Factors Influencing Components
- ↑ R: Hypocoagulable
- Causes: Anticoagulants, Factor deficiencies, ↓ fibrinogen
- ↓ R: Hypercoagulable
- Causes: ↑ fibrinogen, ↑ platelet function, Procoagulants
- ↓ α angle:
- Leads to: ↑ K ⇒ Hypocoagulable
- Causes: Anticoagulants, Anti-platelets, ↓ fibrinogen, Thrombocytopenia
Septic Shock Progression
Hypercoagulable
Secondary to an underlying disorder:
- Inflammatory state
- Down-regulation of anticoagulant mechanisms
- Intravascular deposition of fibrin
- Activation of fibrinolysis
Secondary Fibrinolysis
Degradation of fibrin and fibrinogen:
- Increasing FDPs (Fibrin Degradation Products)
- FDPs compromise clot formation and integrity
- Depletion of factors
Hypocoagulable
Consuming factors and platelets:
- Bleeding
Primary Fibrinolysis:
- LY30 ≥ 7.5% + CI < 1
Secondary Fibrinolysis:
- LY30 ≥ 7.5% + CI > 3
TEG for Special Scenarios
Cardiac Surgery: Treatment Protocol for TEG–General Guidelines
| TEG Value | Clinical Cause | Suggested Treatment |
|---|---|---|
| R values for plain cup and heparinase cup > 2 min apart | Heparin effect (or endogenous heparinoids) | Consider additional protamine |
| Δ< 1.1, R > 8 min, normal G | Hemodilution | If bleeding, consider DDAVP and/or re-exploration |
| R > 8, Δ > 1.1, G < 6.0 | Factor deficiency | Consider 1 unit FFP for each 2.5 minutes over 8 (R value) |
| ANGLE less than 45° | Low fibrinogen level | Consider 0.06 u/kg cryoprecipitate |
| G < 6.0 | Poor platelet function | Consider DDAVP 0.3 mcg/kg |
| G < 5.7 | Moderate platelet dysfunction | Consider 1 apheresis unit of platelets |
| G < 4.7 | Severe platelet dysfunction | Consider 2 apheresis units of platelets |
| Δ, G, EPL normal but patient is bleeding | Either decreased adhesion, or surgical bleeding | Consider DDAVP 0.3 mcg/kg or 3 units cryo. Consider re-exploration |
| R < 4 minutes | Enzymatic hypercoagulability | Consider enzymatic inhibition if appropriate |
| G > 10.6 | Platelet-based hypercoagulability | Consider platelet inhibition as appropriate |
| Normal R and low/normal G with EPL > 20% | Primary fibrinolysis | Consider antifibrinolytic of choice |
| R < 4, G > 13.2, EPL > 7.5% and < 20% | Secondary fibrinolysis | Consider heparin and antibiotic |
Notes
- First 2 lines are most important – the rest are just TEG interpretation.
- The G-value is a log-derivation of the MA and represents the clot strength using dynes/sec. G increases exponentially in proportion to the amplitude of the tracing.
- Estimated percent lysis (EPL) is used to evaluate clot lysis, giving an idea about the percent lysis at 30 min after MA. The normal value of EPL is 0%-15%.
- Delta (Δ) is the time to the max speed of clot formation and represents thrombin burst.
- first 2 lines are most NB – the rest are just TEG interpretation)
- The G-value is a log-derivation of the MA and is meant to also represent the clot strength using dynes/sec. G increases exponentially in proportion to the amplitude of the tracing.
- Estimated percent lysis (EPL) is also used besides LY30 to evaluate clot lysis which gives an idea about the percent lysis at 30 min after MA. The normal value of EPL is 0%-15%.
- Delta is the time to the max speed of clot formation and represents the thrombin burst
Treatment Protocol in Liver Transplant
| TEG Value | Clinical Cause | Treatment |
|---|---|---|
| R 7-10 mins | ↓ Clotting factors | 1 FFP or 4 ml/kg |
| R 11-14 mins | ↓↓ Clotting factors | 2 FFP or 8 ml/kg |
| R >14 mins | ↓↓↓ Clotting factors | 4 FFP or 16 ml/kg |
| MA 48-54 mm | ↓ Platelet function | 0.3 µg/kg DDAVP |
| MA 42-47 mm | ↓↓ Platelet function | 5 platelet units (1 pool platelets) |
| MA <42 mm | ↓↓↓ Platelet function | 10 platelet units (2 pool platelets) |
| Angle < 45 degrees | ↓ Fibrinogen level | 0.06 u/kg cryoprecipitate |
| LY30 7.5% or greater, CI < 1.0 | Primary fibrinolysis | Antifibrinolytic of choice (tranexamic acid in preanhepatic phase only) |
| LY30 7.5% or greater, CI > 3.0 | Secondary fibrinolysis | Anticoagulant of choice |
| R < 3 mins, MA >75 mm | Prothrombotic state | Anticoagulant of choice |
Platelet Function Testing
Utility of Point-of-Care Platelet Function Testing Devices in Assessing the Effects of Antiplatelet Medications
| Device | Antiplatelet Agent | Strengths | Limitations |
|---|---|---|---|
| PFA-100® | Aspirin | ✓ Cheap, rapid, sensitive assessment of von Willebrand disease and aspirin effects | Wide normal range, influenced by thrombocytopenia and anaemia, not recommended for monitoring of thienopyridines and GPIIb/IIIa inhibitors |
| P2Y12 antagonists | X | ||
| GpIIb/IIIa antagonists | X | ||
| Plateletworks | Aspirin | ✓ Cheap, rapid, provides a platelet count, assessment of all three classes of antiplatelet agents | Requires a cell counter, blood must be tested within 10 min, limited evaluation to date |
| P2Y12 antagonists | ✓ | ||
| GpIIb/IIIa antagonists | ✓ | ||
| TEG® Platelet Mapping | Aspirin | ✓ Assessment of all three classes of antiplatelet agents | Relatively expensive, relatively slow, limited evaluation to date |
| P2Y12 antagonists | ✓ | ||
| GpIIb/IIIa antagonists | ✓ | ||
| VerifyNow | Aspirin | ✓ Rapid, assessment of all three classes of antiplatelet agents | Relatively expensive, effects of thrombocytopenia unknown, interpretation may be complex |
| P2Y12 antagonists | ✓ | ||
| GpIIb/IIIa antagonists | ✓ | ||
| MultiPlate | Aspirin | ✓ Cheap, assessment of all three classes of antiplatelet agents, good agreement with light transmission aggregometry | Manual pipetting required (increased staff training), relatively short shelf life of reagents |
| P2Y12 antagonists | ✓ | ||
| GpIIb/IIIa antagonists | ✓ |
Platelet Function Testing
Gold Standard: Light Transmission Aggregometry
-
Aspirin:
- Mechanism: Suppresses platelet function due to inhibition of COX, leading to decreased thromboxane A₂ (TXA₂) and reduced platelet aggregation.
- Duration: Effects last up to 72-96 hours after stopping due to irreversible inhibition of COX on mature platelets.
-
Clopidogrel:
- Mechanism: Binds irreversibly to P2Y₁₂ ADP-receptor, resulting in decreased ADP-induced aggregation.
- Duration: Effects last up to 7 days.
- Monitoring: Monitored with P2Y₁₂ assay.
Platelet Mapping
- Purpose: Provides the degree of inhibition of platelets via the ADP (Plavix) and AA (Aspirin) pathways, thereby assessing the effectiveness of antiplatelet drugs, which cannot be done with routine coagulation tests.
- Procedure: Involves four separate (channels) analyses:
- Baseline: Kaolin activates platelets maximally as in regular TEG.
- Activator: Heparin (via heparinized tube) inhibits thrombin, and activator (reptilase and Factor XIIIa) converts fibrinogen to fibrin.
- ADP: Includes the fibrin clot activator and ADP, which activates platelets via the GP IIb/IIIa receptor.
- AA: Includes the fibrin clot activator and arachidonic acid, which activates the thromboxane A₂ pathway, producing platelet aggregation.
- Determination: By comparing the relative strengths of the clots in the activator, ADP, or AA cups with the baseline, the percent platelet inhibition can be determined.
- Residual Function: The residual function (percent aggregation) is multiplied by the baseline G to get the net G or net clot strength.
- Goal: To maintain net clot strength between 5 and 9 to prevent bleeding or thrombosis.
Links
- Polytrauma and haemorrhagic shock
- Blood transfusions and conservation strategies
- Clotting cascade
- Blood conservation
- General ICU
References:
- Srivastava, A. P. and Kelleher, A. (2013). Point-of-care coagulation testing. Continuing Education in Anaesthesia Critical Care &Amp; Pain, 13(1), 12-16. https://doi.org/10.1093/bjaceaccp/mks049
- Wells, M., Raja, M., & Rahman, S. (2022). Point-of-care viscoelastic testing. BJA Education, 22(11), 416-423. https://doi.org/10.1016/j.bjae.2022.07.003
- Enriquez, L. J. and Shore‐Lesserson, L. (2009). Point-of-care coagulation testing and transfusion algorithms. British Journal of Anaesthesia, 103, i14-i22. https://doi.org/10.1093/bja/aep318
- FRCA Mind Maps. (2024). Retrieved June 5, 2024, from https://www.frcamindmaps.org/
- Anesthesia Considerations. (2024). Retrieved June 5, 2024, from https://www.anesthesiaconsiderations.com/
- ICU One Pager. (2024). Retrieved June 5, 2024, from https://onepagericu.com/
- Open Anesthesia. (n.d.). Viscoelastic Tests. Retrieved from https://www.openanesthesia.org/keywords/viscoelastic-tests/
Summaries:
TEG summary
Viso-elastic testing-video
Copyright
© 2025 Francois Uys. All Rights Reserved.
id: “82d41d63-a0ec-4da1-926e-32c48265d837”