{}
Summary
Evidence Based Medicine
Classes of Evidence
Class of Recommendations
| Class of Recommendations | Definition | Suggested Wording to Use |
|---|---|---|
| Class I | Evidence and/or general agreement that a given treatment or procedure is beneficial, useful, effective | Is recommended/is indicated |
| Class II | Conflicting evidence and/or a divergence of opinion about the usefulness/efficacy of the given treatment or procedure | |
| Class IIa | Weight of evidence/opinion is in favour of usefulness/efficacy | Should be considered |
| Class IIb | Usefulness/efficacy is less well established by evidence/opinion | May be considered |
| Class III | Evidence or general agreement that the given treatment or procedure is not useful/effective, and in some cases may be harmful | Is not recommended |
Level of Evidence
| Level | Definition |
|---|---|
| Level A | Data derived from multiple randomised clinical trials or meta-analyses |
| Level B | Data derived from a single randomised clinical trial or large non-randomised studies |
| Level C | Consensus of opinion of the experts and/or small studies, retrospective studies, registries |
Types of Studies (Detailed)
| Level | Type of Study |
|---|---|
| 1a | Systematic Review/Meta-Analysis of Randomised Controlled Trials (RCTs) |
| 1b | Individual Randomised Controlled Trial (RCT) |
| 2a | Systematic Review/Meta-Analysis of Cohort Studies |
| 2b | Individual Cohort Study (including low-quality RCT) |
| 3a | Systematic Review/Meta-Analysis of Case-Control Studies |
| 3b | Individual Case-Control Study |
| 4 | Case Series (and poor quality cohort and case-control studies) |
| 5 | Expert Opinion without explicit critical appraisal, or based on physiology, bench research or “first principles” |
Hierarchy of Scientific Evidence
- Strongest to weakest Evidence
- Meta-analyses & systematic reviews
- Randomized controlled trials
- Cohort studies
- Case-control studies
- Cross-sectional studies
- Animal trials & in vitro studies
- Case reports, opinion papers, and letters
Types of Data
Qualitative (Categorical)
- Nominal:
- Examples: Male/Female (Binary), Blood group (Non-binary)
- Ordinal:
- Examples: ASA score, Year of registration
Quantitative (Numerical)
- Interval:
- Examples: Date, Temperature (Zero is arbitrary)
- Ratio:
- Examples: Age, Height, Income (Has a true zero)
Data Categories and Characteristics
- Ratio Data:
- Constant units along the scale with a meaningful zero.
- Examples: Age, Height, Income, Mass, Length, Pressure.
- Interval Data:
- Constant units along the scale but no meaningful zero.
- Examples: Date, Temperature.
- Often used in compound assessment tools for quality of life, anxiety/depression, or mobility/function.
- Ordinal Data:
- Progressive, directional scale with no guarantee of consistency in unit size.
- Examples: Pain score, Satisfaction scores, ASA score.
- Nominal Data:
- Categorical, with no meaningful directional scale.
- Examples: Type of delivery, Ethnicity.
Descriptive/Summary Statistics
- Continuous (Ratio/Interval) Data:
- Summarised using the mean as a measure of location/average/central tendency.
- Standard deviation (SD) is used as a measure of spread/dispersion.
- Non-normal Ratio/Interval Data and Ordinal Data:
- More appropriate to use order statistics: minimum, first quartile, median, third quartile, maximum.
- Interquartile range (IQR) contains the central 50% of the data, analogous to the SD for normally distributed data.
- Median replaces the mean as a measure of ‘average’.
- Categorical Data (Nominal, Binary, and some Ordinal Data):
- Summarised using the actual numbers with percentages in parentheses for each category.
Definitions
Statistical Concepts
95% Confidence Interval
Represents the range of values that are 95% likely to contain the real value.
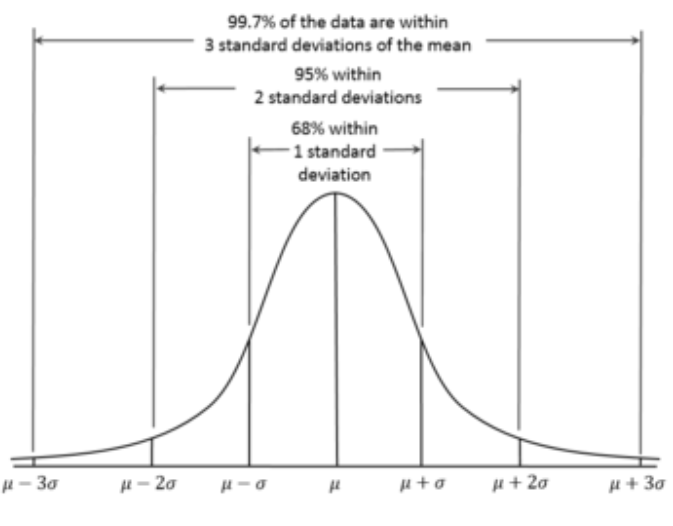
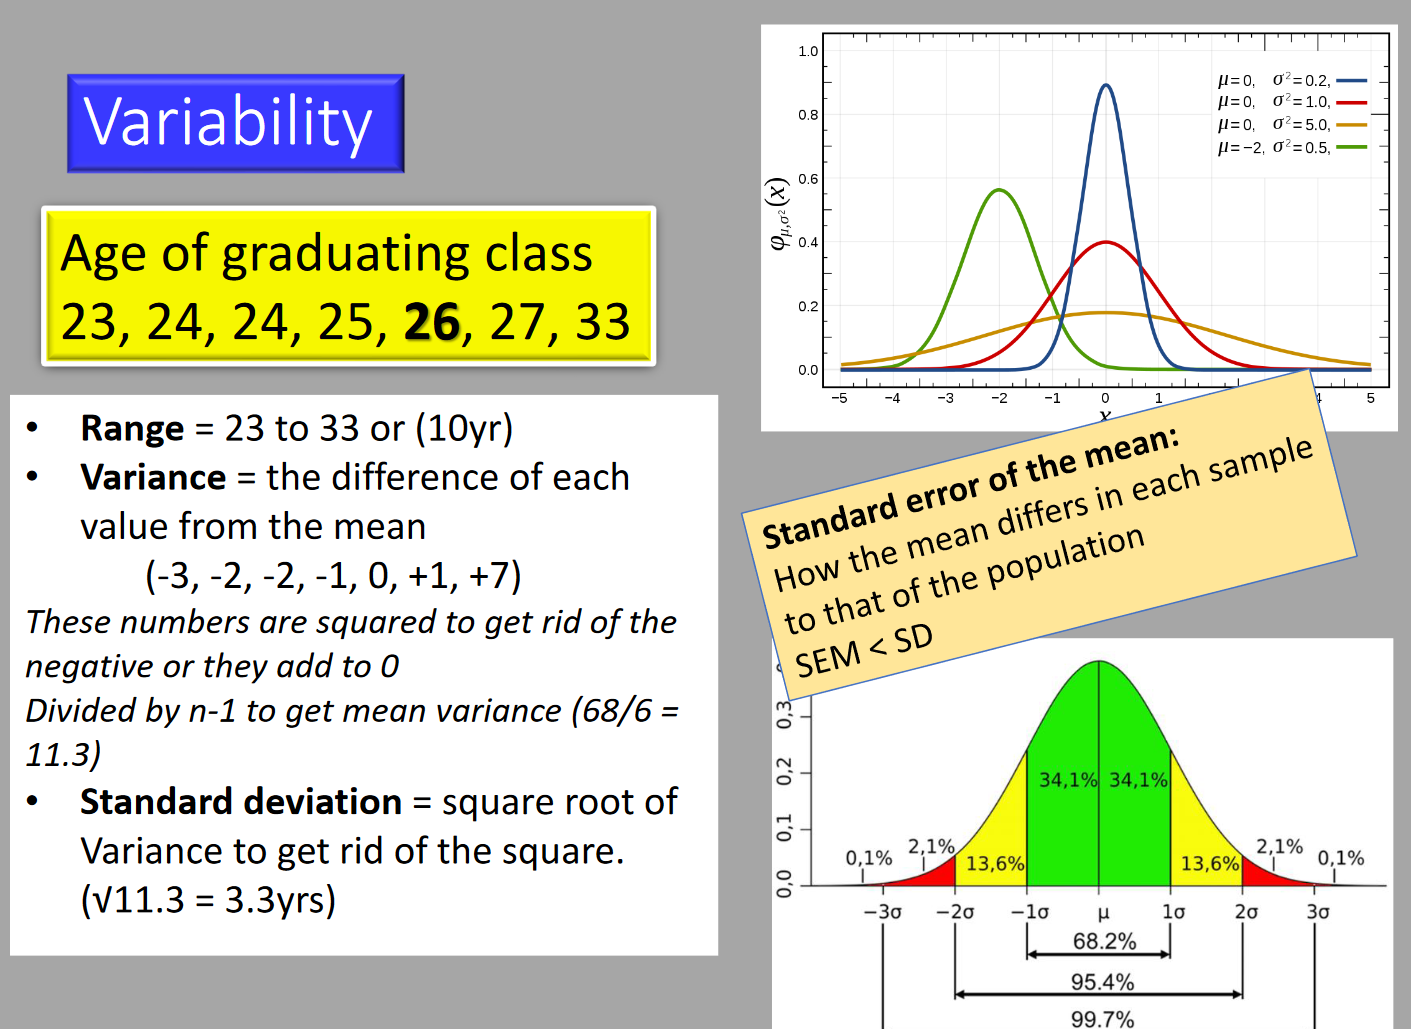
Standard Deviation (SD)
A measure of variance from the mean.
- 1 SD contains 68% of the population.
- ±1 SD contains 95% of the population.
- ±2 SD contains 99.7% of the population.
Mean
The average value for the set of numbers. Best when data is symmetrically distributed. Variability is described by the SD.
Median
The middle value, preferred for asymmetrical distribution. May be used for interval or ordinal data. Variability is described by the interquartile range (IQR).
Mode
The most common value. Only useful for measuring central tendency in nominal categorical data (e.g., gender).
Normal Distribution
An equal number of values on either side of the mean, forming a bell-curve.
Research Terminology
Aims
Statements of intent written in broad terms, setting out what you hope to achieve at the end of the project.
Objectives
Specific statements that define measurable outcomes, e.g., steps taken to achieve the desired aims.
Statistical Significance
Indicates the reliability of the study results.
Clinical Significance
Reflects the impact of the results on clinical practice (applicability).
Null Hypothesis
Assumption that the theory is not true, tested to determine validity.
Alternative Hypothesis
The hypothesis that there is an effect or a difference.
p-value
The probability that a given event occurred by chance.
- p < 0.05: Less than 5% chance that the events examined are purely by chance.
Errors in Hypothesis Testing
Type I Error
The probability of detecting a difference where none exists (false positive → ↓ specificity).
Type II Error
The probability of failing to detect a difference (false negative → ↓ sensitivity).
Data Distribution
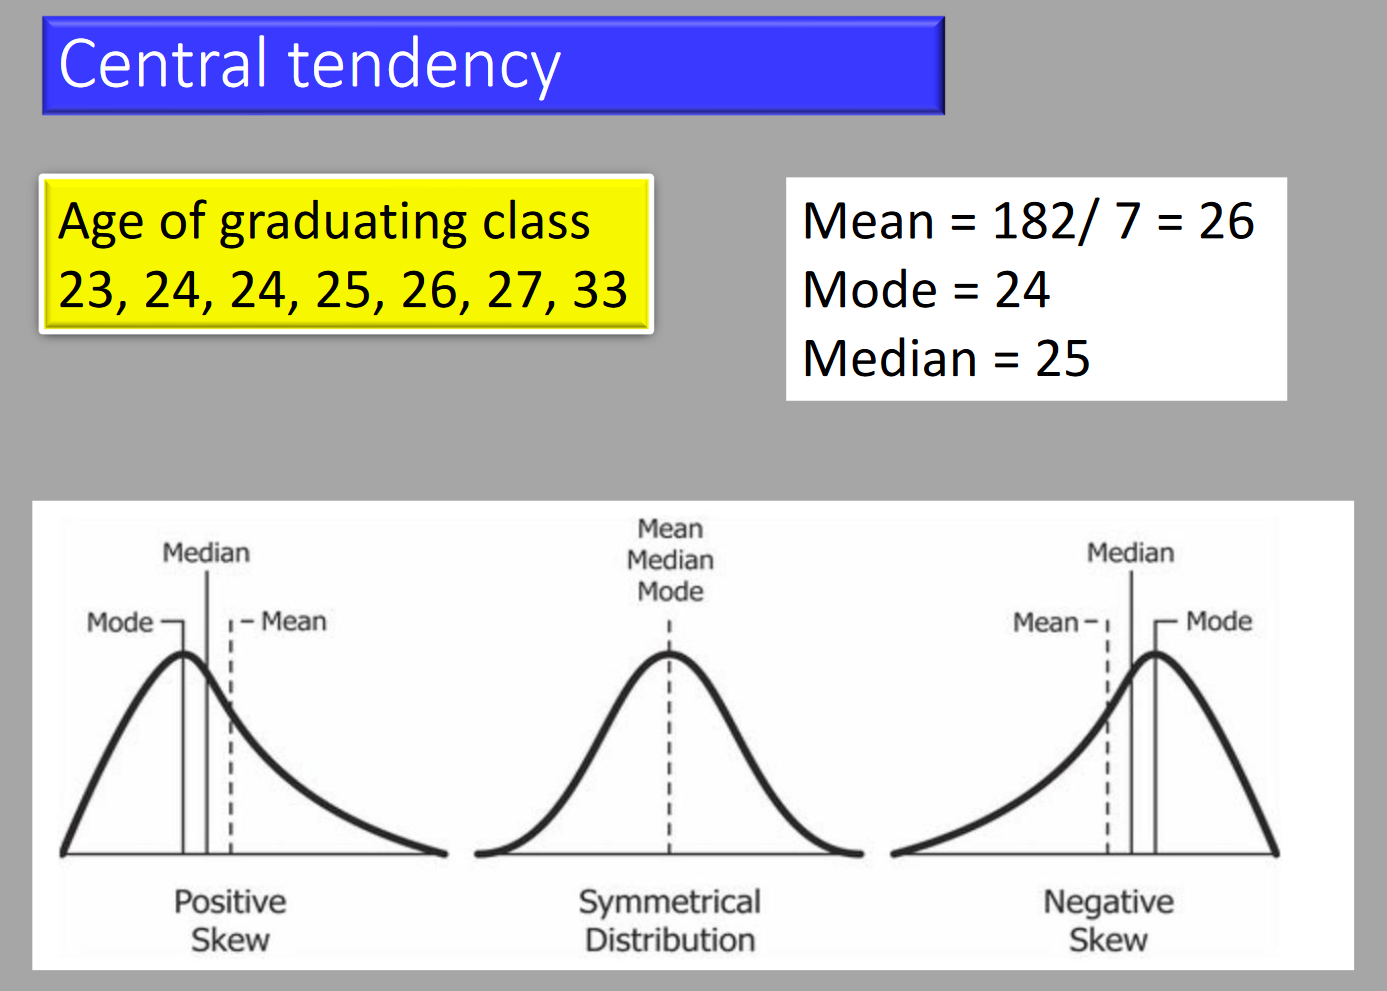
Skewed Distribution
Skewness describes the symmetry of a curve, whilst kurtosis describes the peakedness.
- Normal distribution has kurtosis of 0.
- Higher kurtosis: sharper peak and longer tail.
Diagnostic Testing
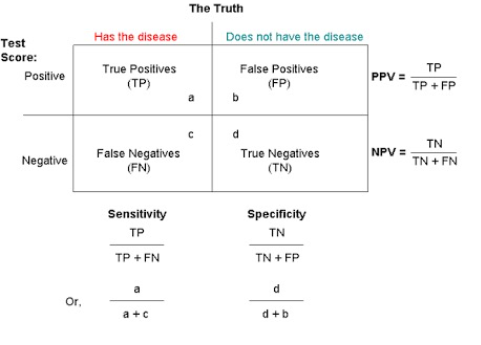
Sensitivity and Specificity
Sensitivity (True Positive Rate)
- Detects the presence in patients who actually have a condition.
- Rules OUT having the condition if test is negative.
Specificity (True Negative Rate)
- Confirms the absence in patients who do not have the condition.
- Rules IN having the condition if test is positive.
Predictive Values
Positive Predictive Value (PPV)
Percentage of patients with a positive test who actually have the disease.
Negative Predictive Value (NPV)
Percentage of patients with a negative test who do not have the disease.
Statistical Measures
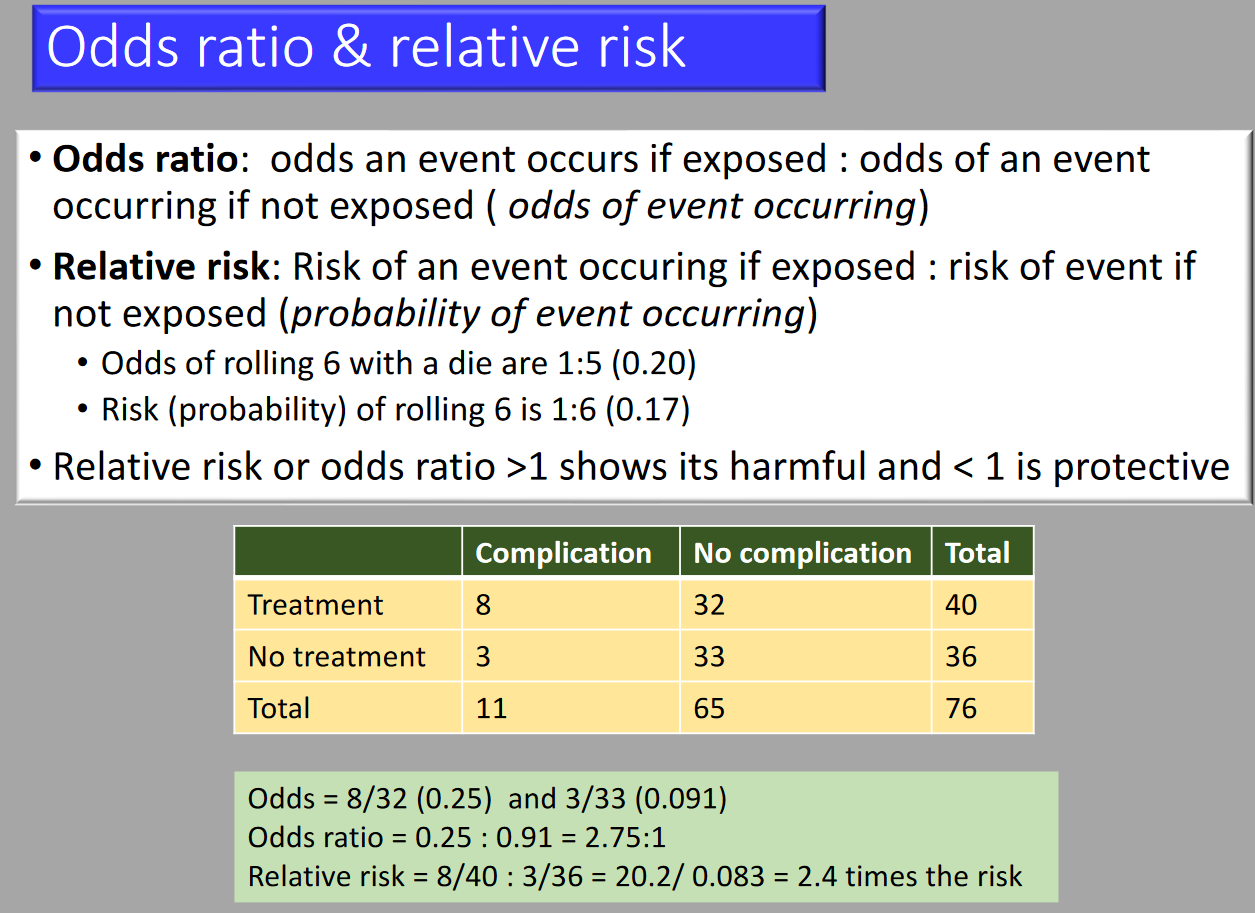
Relative Risk
A ratio of probabilities (prospective studies). Compares the incidence or risk of an event among those with a specific exposure to those who were not exposed.
Odds Ratio
A ratio of ratios. Compares the presence to absence of an exposure given a specific outcome.
- Correlation
- The association between 2 sets of numbers.
- Correlation coefficient (r-value): Indicates strength and direction of linear relationship (-1 to 1).
- Pearson’s correlation: Used if both variables are normally distributed.
- Spearman’s correlation: Used if data is skewed.
- Linear regression: Establishes the equation of the relationship and confidence interval.
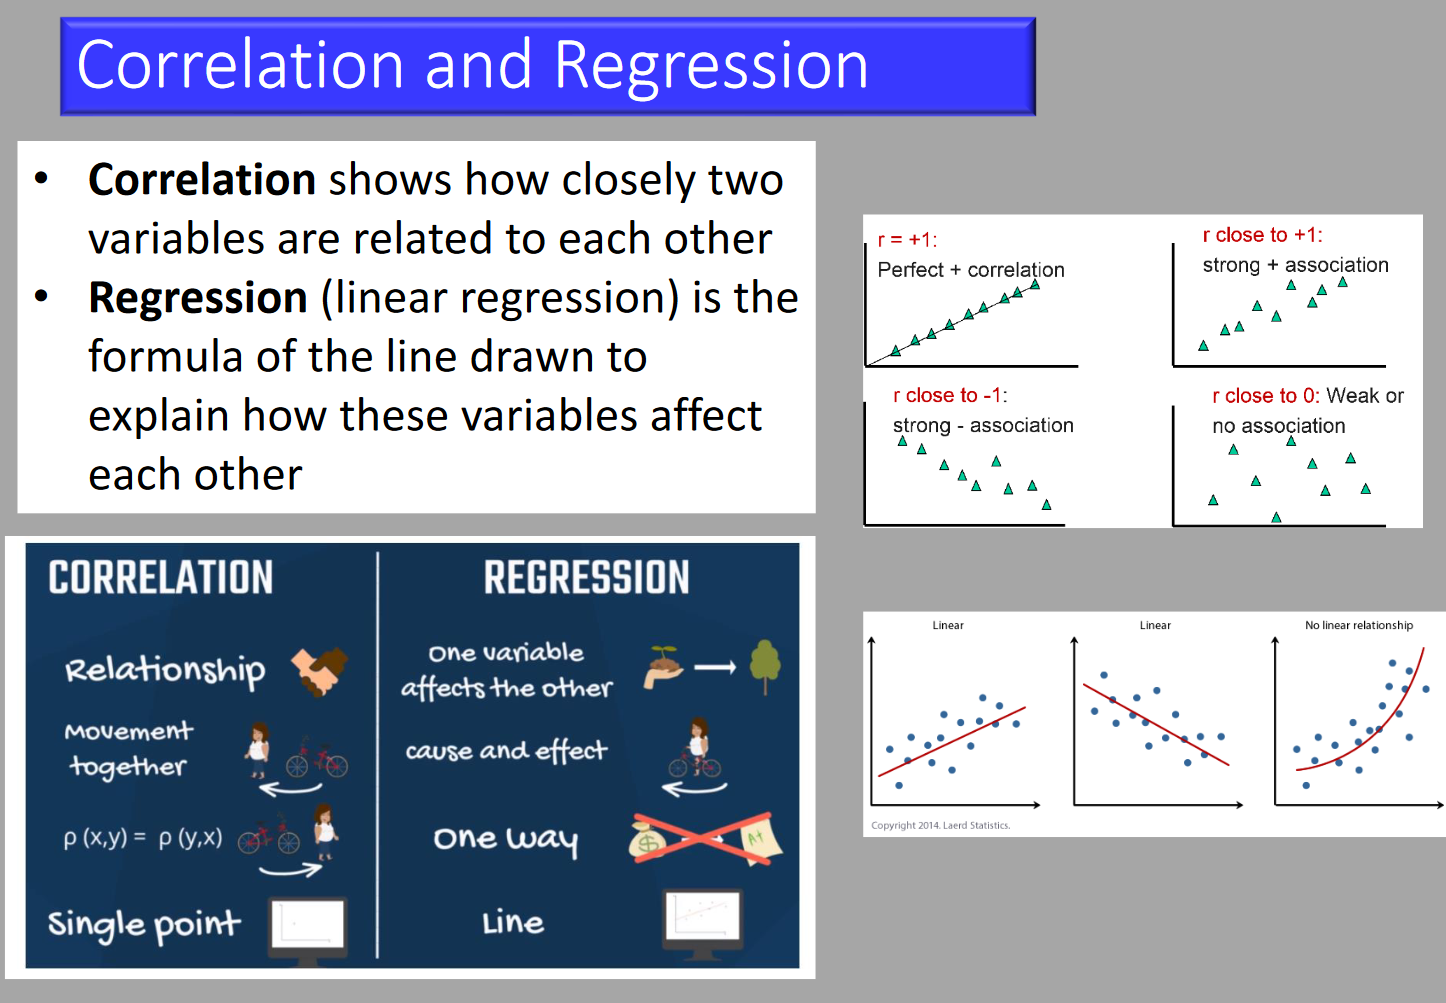
- Regression
- The predictive relationship between two sets of numbers.
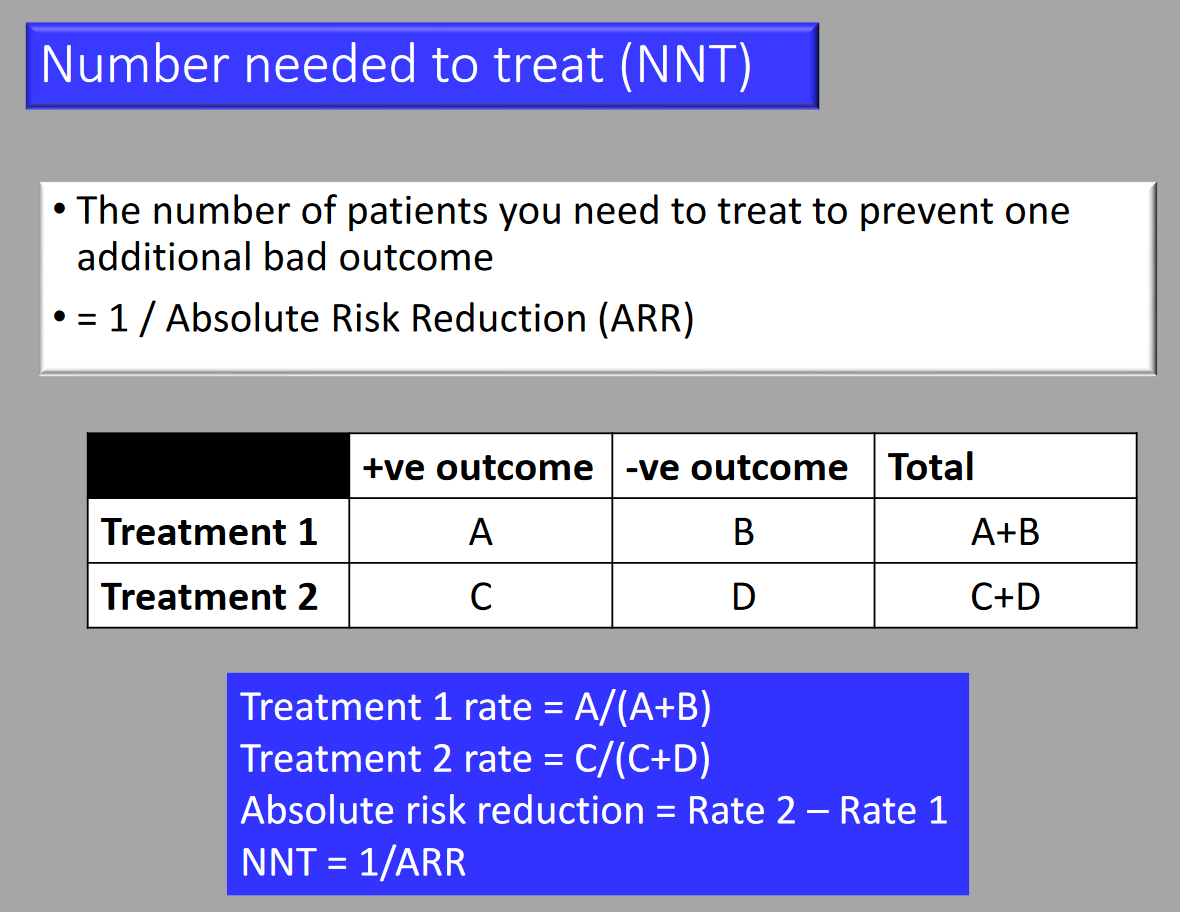
- Number Needed to Treat (NNT)
- The number of patients that need to be treated to prevent one disease event.
- Chi-squared Test
- A non-parametric test for differences between group data as they appear on the contingency table. Tests the null hypothesis by estimating the significance of differences between the column and row variables. Not used if any cell value < 5 (use Fisher’s Exact test).
- Likelihood Ratio
- Combines sensitivity and specificity to assess the value of performing a diagnostic test.

Research Structure
- Aim
- Broad summary statement of purpose. Covers the “What?”
- Objective
- Operational steps describing how the aim(s) will be reached. Covers the “How?”
- Hypothesis
- Testable opposing statements: Null hypothesis (to be nullified) and alternative hypothesis.
Example of Correlation
- The following correlation plots are taken from a study assessing the use of central venous pressure (CVP) to predict ventricular filling volume or cardiac performance in response to a fluid challenge
a) Interpret the results of the correlation plots labelled Figure 1 and Figure 2. (2)
b) What can be deduced from the results presented above? (2)
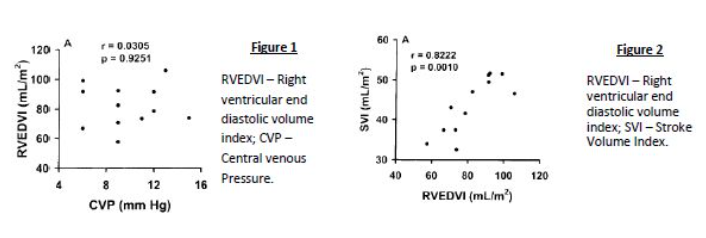
c) What is the name, in statistical terms, used to describe the graph below?
a) Figure 1 has a low r value (weak association) and high p value (the association is insignificant) whereas Figure 2 has a high r value (very strong association) and a low p value (the association is statistically significant)
b) We can deduce that there is a strong link between SVI and RVEDVI which is statistically significant, but RVEDVI correlates poorly with CVP and hence the latter is a poor predictor of cardiac performance.
c) Histogram
Probability
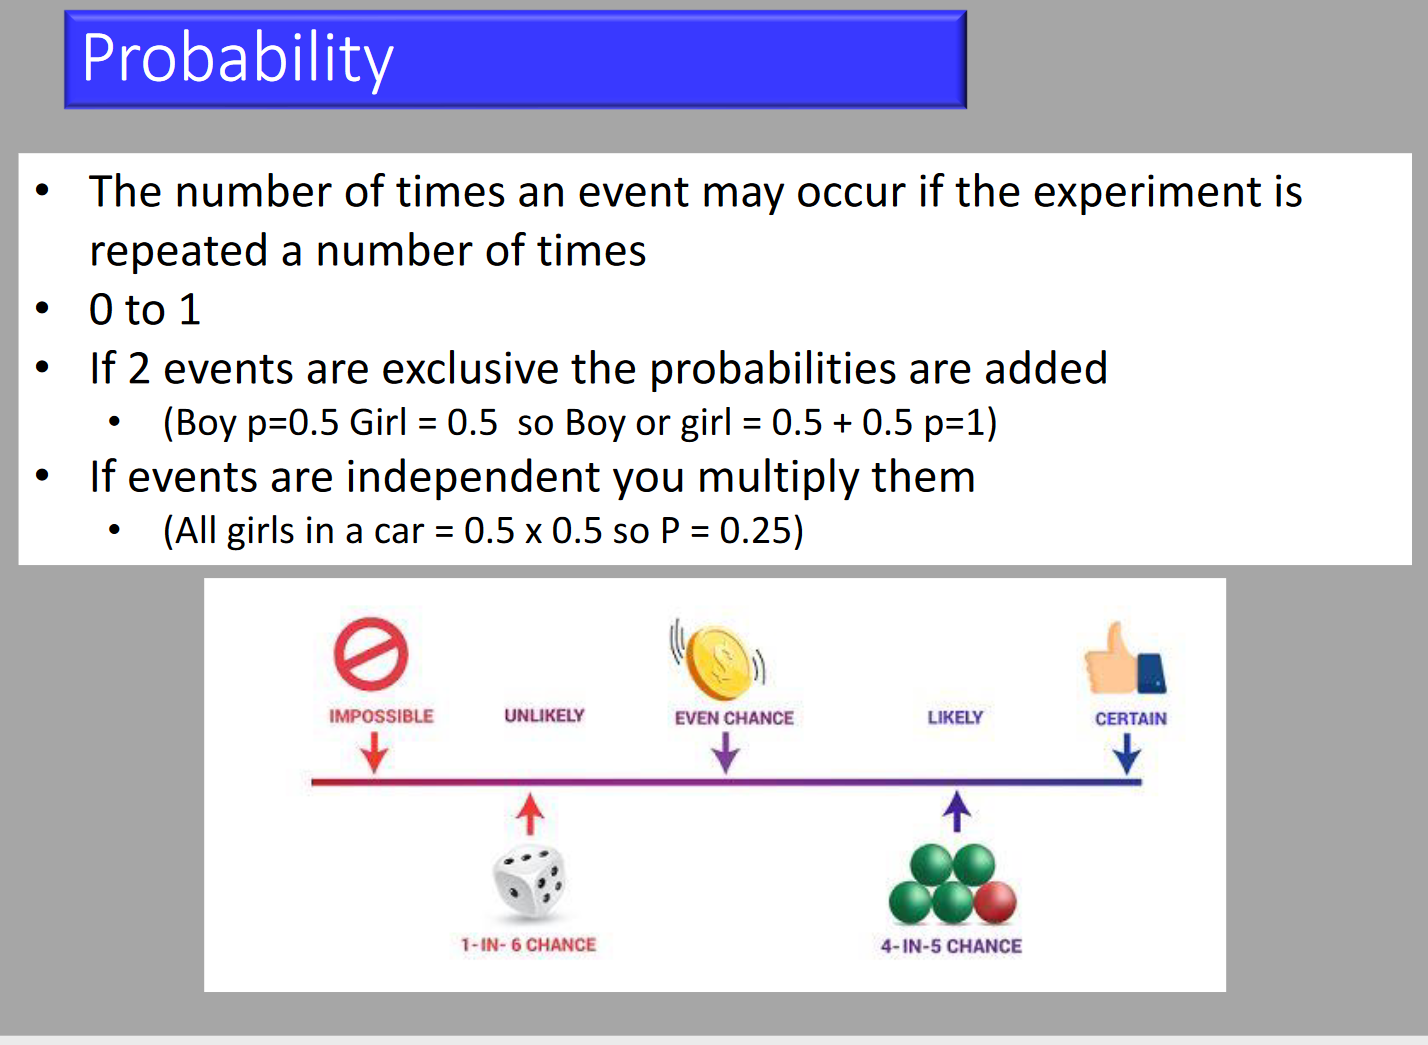

- Probability (P)
- Probability is an expression of the relative frequency that a given event occurs in an infinite number of trials. It indicates how typical a sample dataset is of the population from which it was drawn. Probability ranges from 0 (the event never occurs) to 1 (the event always occurs).
- Null Hypothesis
- The assumption that the theory being tested is not true. This hypothesis is tested to determine if there is enough evidence to reject it.
- p-value
- The probability that a given event occurred by chance.
- p < 0.05: Indicates that there is less than a 5% chance that the events examined in the statistical analysis are purely the result of chance.
Types of Errors
Type I Error
- The probability of detecting a difference where none exists (false positive), leading to decreased specificity.
Type II Error
- The probability of failing to detect a difference (false negative), leading to decreased sensitivity.
Hypothesis Testing and Statistical Significance
Hypotheses
-
Null Hypothesis:
- No relationship exists between the variables. Effect occurs due to chance.
-
Alternative Hypothesis:
- The independent variable affects the dependent variable. Not due to chance.
P-value
- Definition:
- Indicates how likely the observed data would occur by chance if the null hypothesis is true.
- Smaller p-value = stronger evidence against the null hypothesis.
- p-value ≤ 0.05 is statistically significant.
Statistical Significance
- Significance Threshold:
- p-value ≤ 0.05 is statistically significant.
- < 5% probability the results are random.
- Accept alternative hypothesis if significant.
Risk
- Absolute Risk (AR): The probability of an event happening absolutely, calculated as the number of events divided by the total participants in that group.
- ARC: The AR of events in the control group, calculated as events divided by total participants in the control group (events + non-events).
- ART: The AR of events in the treatment group, calculated as events divided by total participants in the treatment group (events + non-events).
- Relative Risk (RR): Compares the AR between the treatment and control groups.
- RR = ART / ARC
- Absolute Risk Reduction (ARR): The difference in event rates between the treatment and control groups.
- ARR = ART–ARC
- Relative Risk Reduction (RRR): The proportion by which treatment reduces the event rate.
- RRR = 1 – RR
- Number Needed to Treat (NNT): The number of patients that need to be treated for one to benefit.
- NNT = 100 / ARR
- Odds: Examines the probability of an event happening compared to not happening.
- O = events / non-events
- Odds Ratio (OR): Compares the odds between the treatment and control groups.
- OR = OT / OC
Note: If given a question like this, work out the absolute risk for each group, then the relative risk. The rest follows easily.
For example, if one girl and one boy are born, the risk of having a boy is 1 (boy) / 2 (boys + girls) = 0.5, but the odds are 1:1!
Risk Calculations
| Event/Group | Event | Non-event |
|---|---|---|
| Treatment Group | a | b |
| Control Group | c | d |
- Absolute Risk: a/(a+b) and c/(c+d)
- Odds: a/b and c/d
- Relative Risk: [a/(a+b)] / [c/(c+d)]
- Odds Ratio: [a/b] / [c/d]
- Absolute Risk Reduction: a/(a+b) – c/(c+d)
- Number Needed to Treat: 100/[a/(a+b) – c/(c+d)]
- Relative Risk Reduction: 1 – [a/(a+b)] / [c/(c+d)]
Meta-analysis
-
Definition:
- Combines results of multiple studies to produce an overall result.
- Increases sample size.
- Considered an observational study.
-
Problems:
- Exclusion of relevant studies.
- Inclusion of poor studies.
- Unpublished studies often not included.
- Undue influence from big studies or outliers.
- Multiple investigator differences.
- Complex statistics due to variable data.
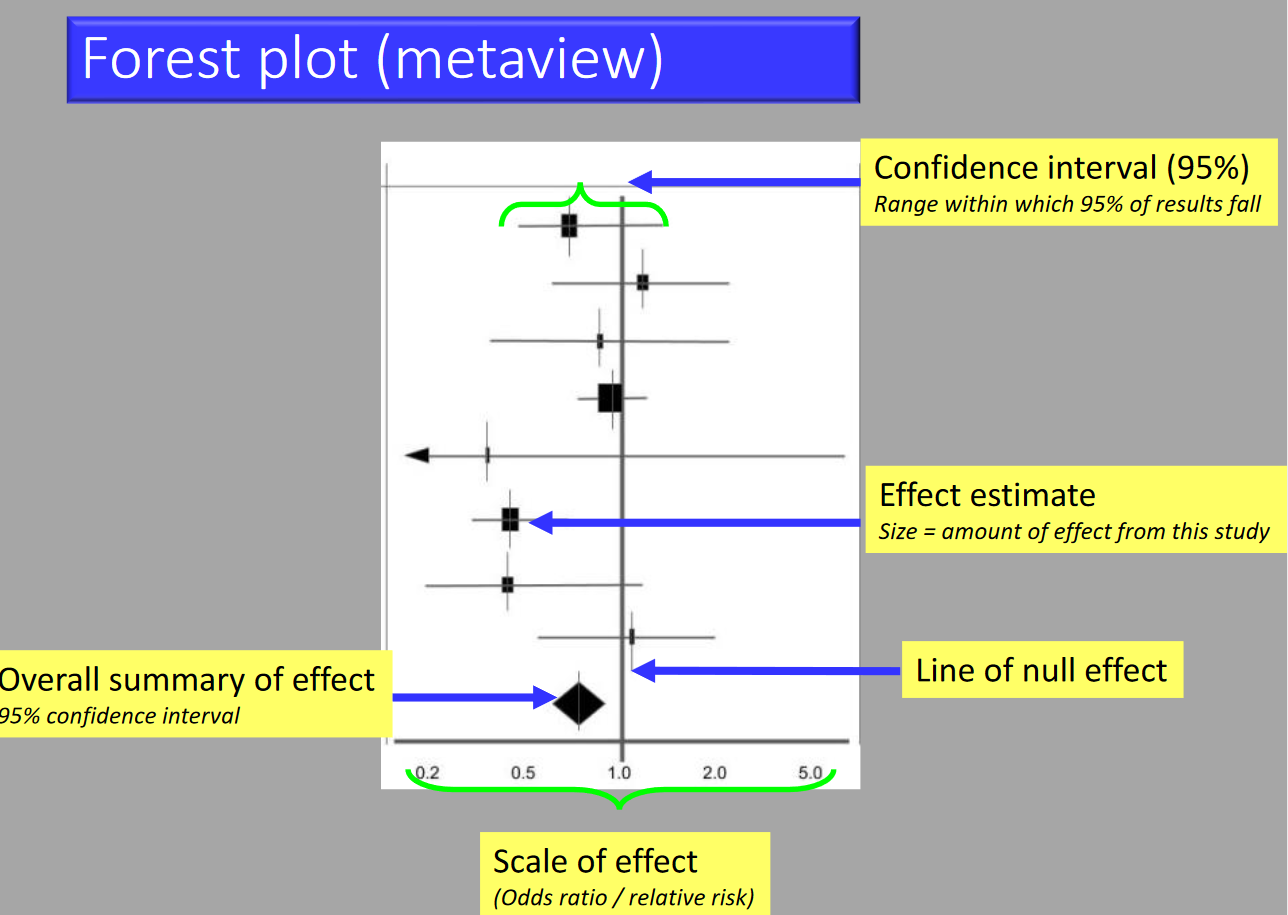
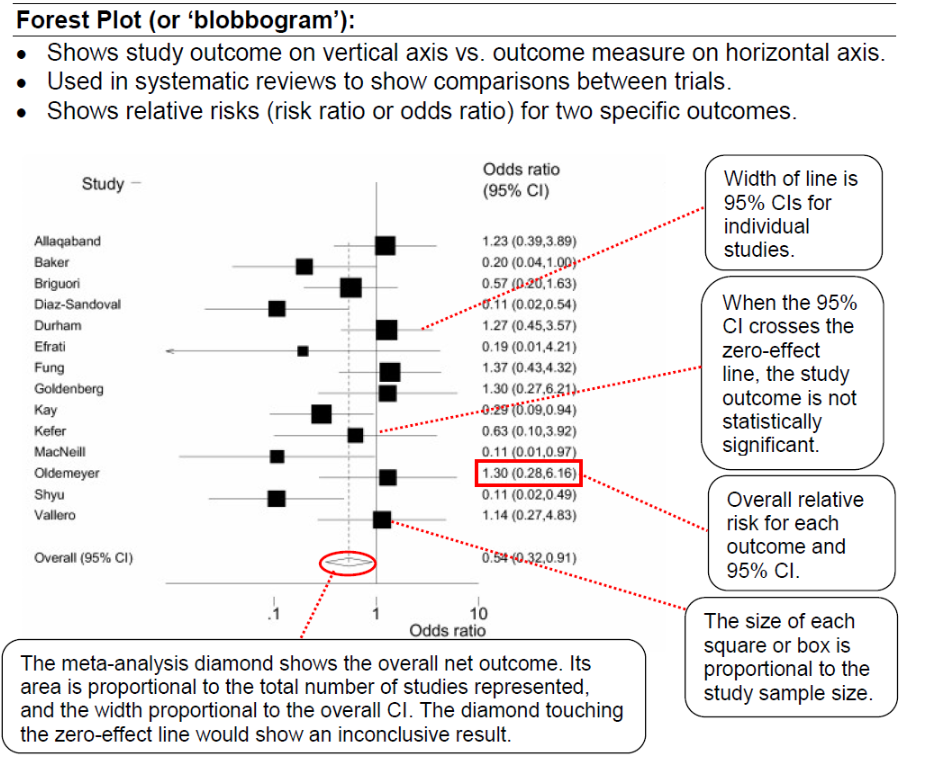
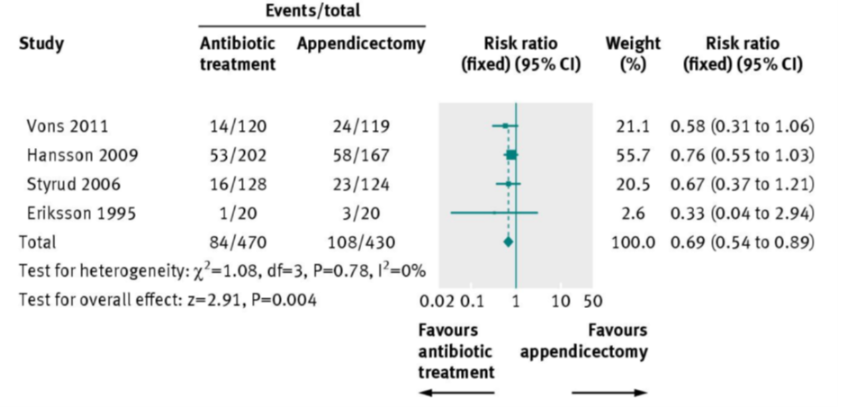
Example
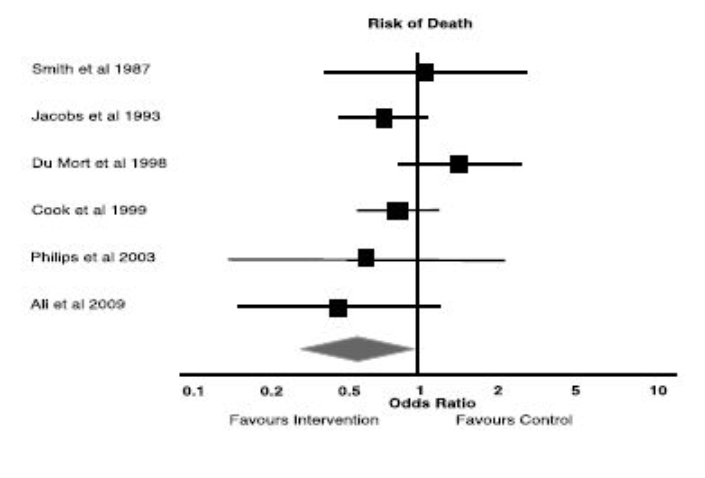
a) What statistical method is being illustrated here? (2)
b) When would one use this method? (2)
c) What do the boxes on the horizontal lines represent? (1)
d) What do the lines represent? (1)
e) What can you conclude from the diagram above? (1)
f) What is the Odds Ratio? (2)
g) What is Relative Risk? (2)
h) What does the diamond represent?
Answer
a) Meta analysis in the form of a forest plot
b) Useful when assimilating data from multiple similar studies to measure an overall effect using all of the available evidence
c) The boxes represent the mean value as an odds ratio and 95% confidence interval
d) The lines represent range of treatment effect for each study
e) Analysis: All studies cross the line of null effect → not statistically significant
f) Odds Ratio: the odds that an outcome will occur given a particular exposure, compared to the odds of the outcome occurring in the absence of that exposure.
g) Relative Risk: The ratio of risk in the treated group vs the untreated group.
h) Diamond represents the overall analysis of the effect and confidence interval
Other
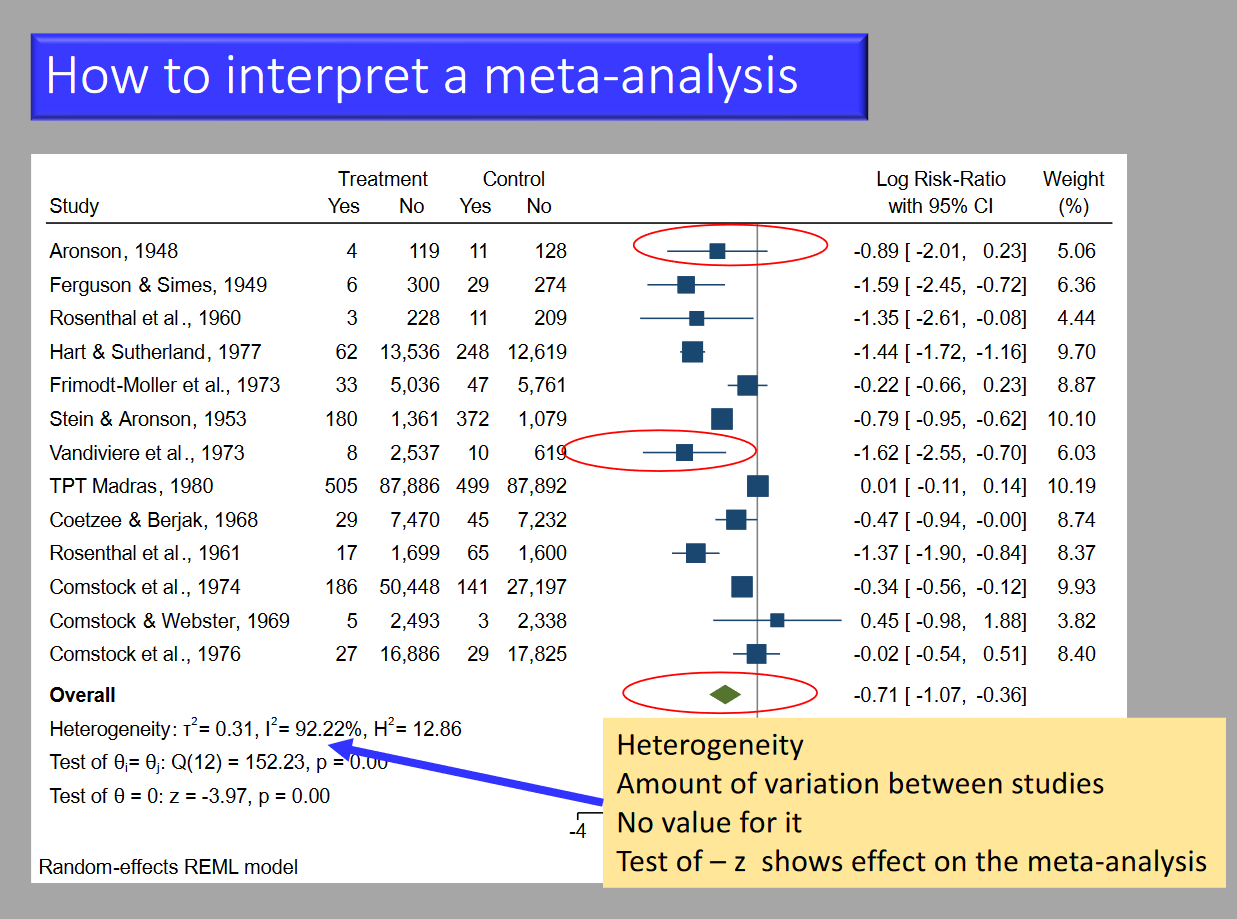
Markers of Heterogeneity on a Forest Plot
Chi-Squared Test
- Assumptions:
- Null hypothesis is correct (homogeneity).
- Provides a p-value to test the hypothesis.
- P-value <0.1 is the cutoff; <0.1 = bad.
I²
- Percentage of variation due to heterogeneity rather than chance.
- More than 50% = bad.
Tau²
- Extent of variation among effects observed in different studies.
- Reported with a p-value <0.1 (significant if <0.1).
Implication of Heterogeneity
- Low heterogeneity implies that it is appropriate to pool these studies into a meta analysis and that the findings are generalisable
Meta-analysis Vs Systematic Review
A systematic review refers to the entire process of selecting, evaluating, and synthesizing all available evidence, while the term meta-analysis refers to the statistical approach to combining the data derived from a systematic-review
Advantage of Meta-analysis
Conclusion is stronger than any single study once the data is pooled. External validity is strengthened.
Aims of Meta-analysis
To pool the estimated effect of interest and identify sources of variation (heterogeneity), ideally as part of a systematic review
Power
-
Definition:
- Ability to detect a difference between groups when it actually exists.
- Depends on sample size and group differences.
-
Type I Error (α):
- False positive.
- Concluding differences exist when they do not.
-
Type II Error (β):
- False negative.
- Concluding no differences exist when they actually do.
a) Power = 1 – β where β is the probability of a type II error
Factors Influencing Power
Sample size: Larger increases power
Treatment effect: More effective → ↑ difference between groups → ↑ power
Measurement variability (s²): Less increases power
Level of significance (α): greater value increases power
Box and Whisker Plot
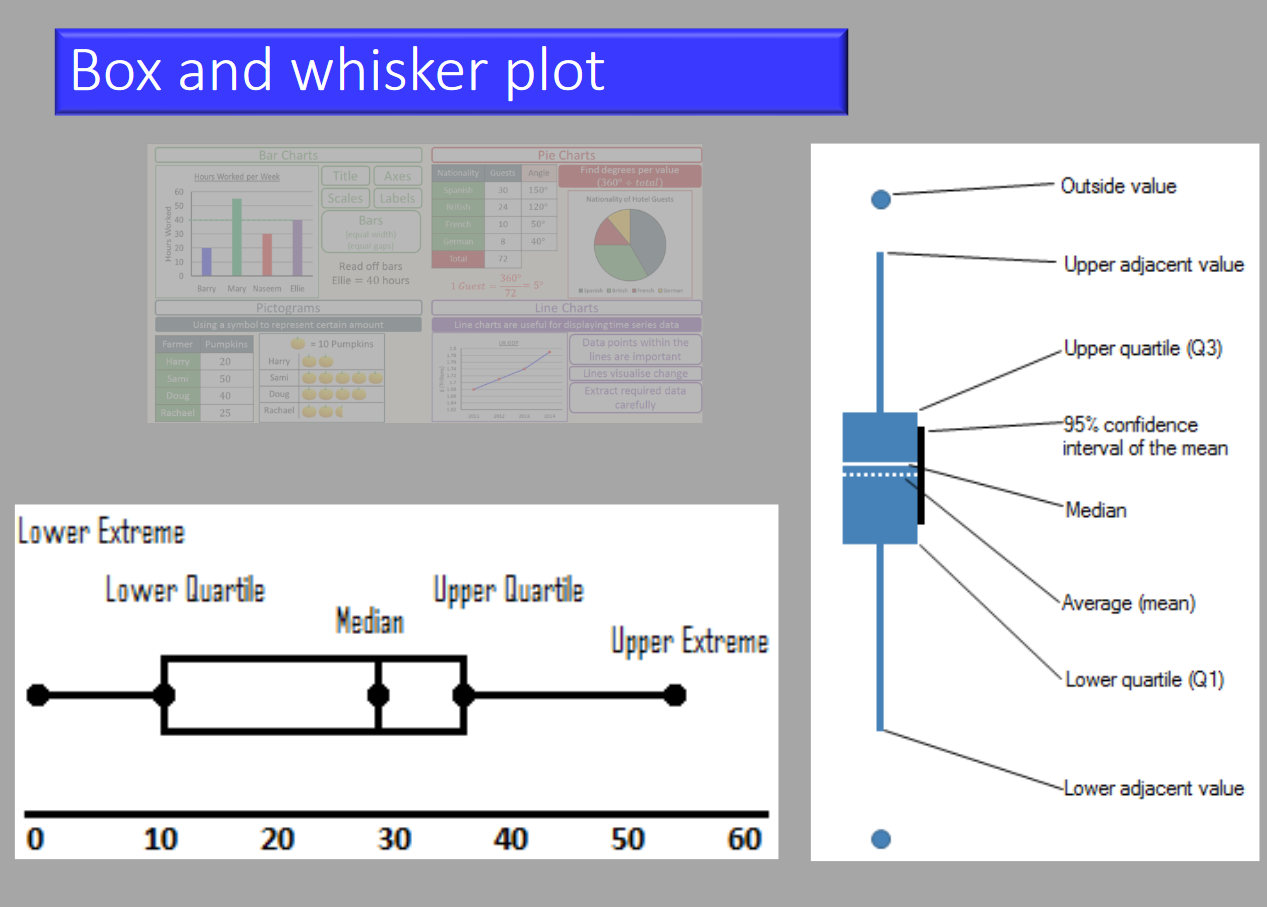
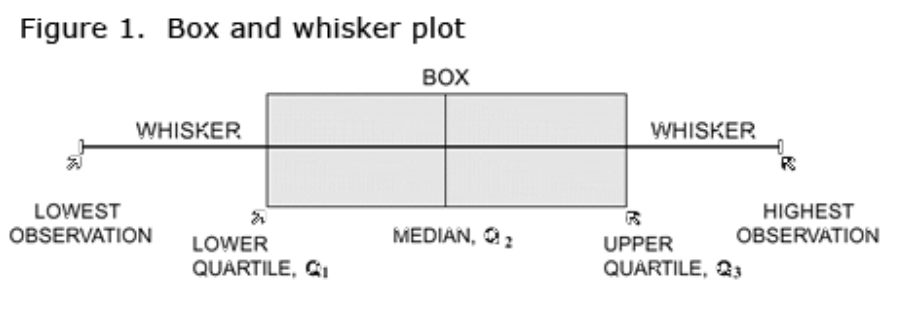
In a box and whisker plot:
- The ends of the box are the upper and lower quartiles, so the box spans the interquartile range (25th-75th)
- The median is marked by a vertical line inside the box
- The whiskers are the two lines outside the box that extend to the highest and lowest observations (range).
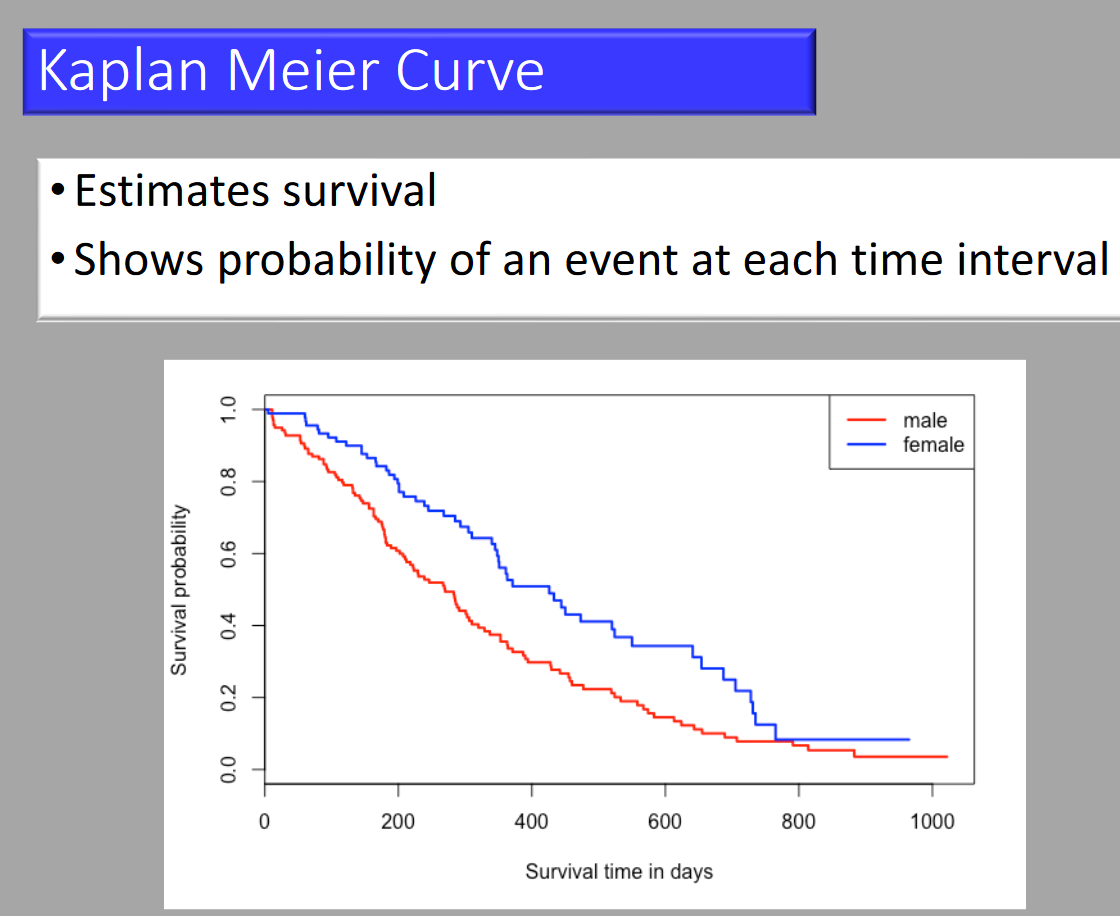
Kaplan-Meier Curve
Cross-over Study
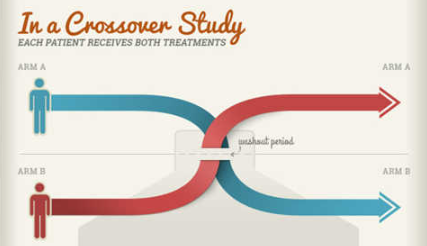
a) Crossover Advantage: It improves the exchangeability of comparison groups (counterfactual comparison) by allowing each person to act as their own control. This method is more efficient in terms of sample size, as each participant produces two sets of observations.
b) Confidence Interval (CI) Used Instead of P-Value:
- Non-inferiority (and equivalence) studies employ a two one-sided test (TOST) approach to null hypothesis significance testing, which depends on a confidence limit not exceeding the non-inferiority (or equivalence) margin. There are two null hypotheses (H0) and two p-values in this type of design.
c) Changing Practice:
i. Sample size > 300 events
ii. Directness: Studying healthy vs ill participants
iii. Outcomes: Direct vs surrogate
RCT
Advantages and Disadvantages of RCTs
Advantages
- Best method for evaluating efficacy.
- Randomisation avoids confounding.
- Bias minimized by allocation concealment and blinding.
- Explaining cause and effect.
Disadvantages
- Difficult, time-consuming, and expensive.
- Ethical restrictions.
- Strict inclusion/exclusion criteria and volunteer bias reduce generalisability.
- Limited follow-up necessitates surrogate endpoints.
- Inefficient for investigating infrequent adverse effects.
- Non-compliance of controls threatens validity.
Narrative Vs Systematic Reviews
Comparison: Systematic vs. Narrative Reviews
Systematic Review
- Process:
- Clearly defined criteria for selection of articles.
- All available evidence.
- Reproducible.
- Use:
- Answer a specific question.
- Comprehensive report.
- Limitation:
- Limited scope–attempts to answer only the selected question.
Narrative Review
- Process:
- Usually expert-based.
- Methods not described, “supporting” literature but not exhaustive.
- Use:
- Education, general debate.
- Speculate on new types of interventions available.
- Limitation:
- Process is unknown.
- Selection and evaluation biases are unknown.
- Not reproducible.
Comparison: Traditional Literature Review vs. Systematic Review
Traditional Literature Review
- The Review Question/Topic:
- Broad in scope.
- Aim to place one’s own research within the existing body of knowledge.
- Searching for Studies:
- Ad hoc, based on familiar sources.
- Not exhaustive or comprehensive.
- Study Selection:
- Lack of clear reasons for inclusion/exclusion.
- Assessing the Quality of Included Studies:
- Does not consider study quality or biases.
- Synthesis of Existing Research:
- More qualitative.
- May not be based on study quality.
Systematic Review
- The Review Question/Topic:
- Well-defined research question.
- Aim to answer the research question in an unbiased, reproducible way.
- Searching for Studies:
- Comprehensive search of published/unpublished literature.
- Well-documented process.
- Study Selection:
- Explicit reasons for inclusion/exclusion based on research question.
- Assessing the Quality of Included Studies:
- Systematic assessment of study quality and risk of bias.
- Include sources of heterogeneity.
- Synthesis of Existing Research:
- Based on study quality.
- Provides recommendations for practice or knowledge gaps.
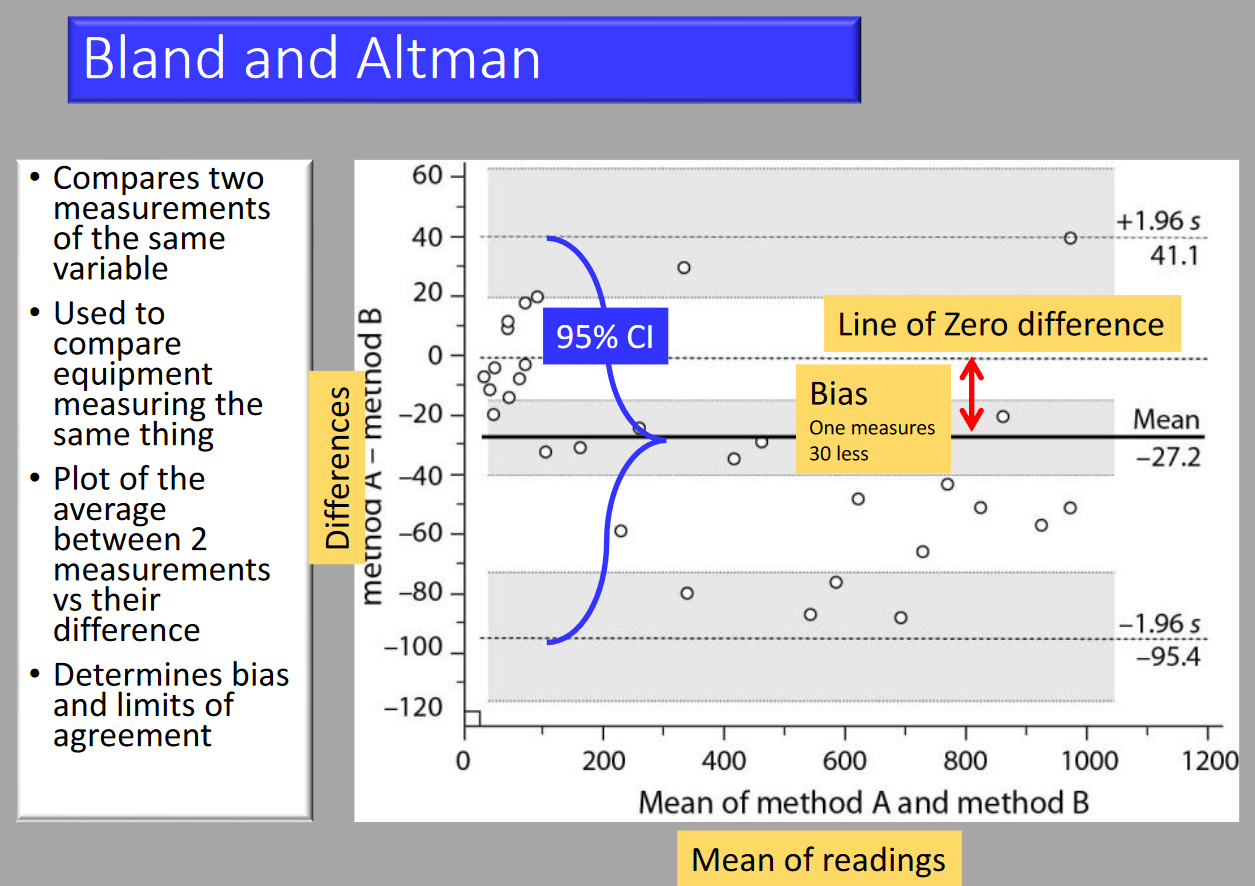
Bland-Altman
- Compares two measurements of the same variable.
- Used to compare equipment measuring the same thing.
- Plot of the average between two measurements vs their difference.
- Determines bias and limits of agreement.
Study Design
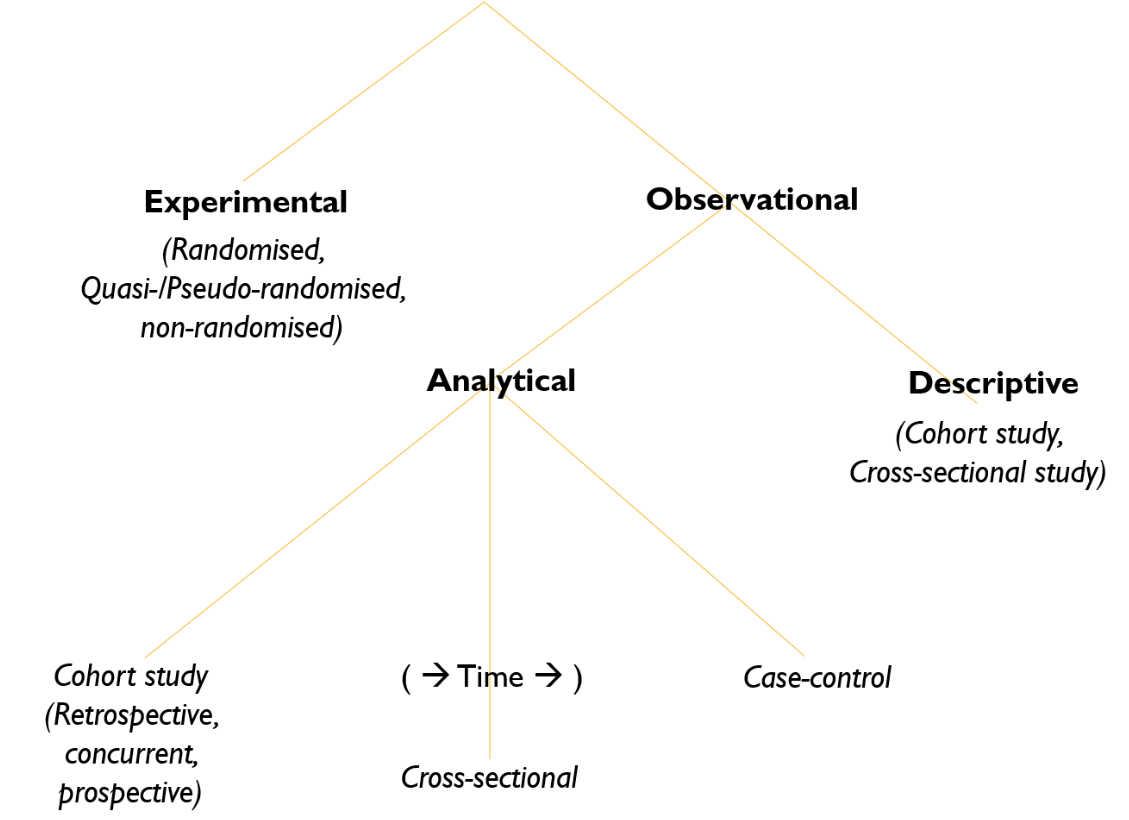
Types of Study Designs
1. Experimental
- Description: Researchers introduce an intervention and study its effects.
2. Observational
- Description: Observing the effect of a risk factor, diagnostic test, treatment, or other intervention without trying to change who is or isn’t exposed to it.
Subtypes of Observational Studies
-
Descriptive
- Purpose: Studies of prevalence (determining how much there is of something in a group).
- Statistical Measure: Confidence Intervals (CI).
-
Analytical
- Purpose: Testing a hypothesis on two or more groups.
- Statistical Measures: p-values, Confidence Intervals (CI).
- Types of Analytical Observational Studies:
- Cohort Study: Longitudinal study that looks forward in time.
- Case-Control Study: Retrospective study that looks backward in time.
- Cross-Sectional Study: A snapshot study that examines data at one specific point in time.
Statistical Tests
Parametric vs. Non-Parametric Tests
Parametric Tests
- Normal distribution of data.
- Quantitative data (Interval or ratio).
- Data has mean and SD.
- Mean is central tendency.
- Powerful.
- Large sample size.
- Samples randomly selected.
- Applies to variable only.
Non-Parametric Tests
- Skewed distribution.
- Qualitative data (Nominal or ordinal).
- Data has percentiles, proportions, median and modes.
- Median is central tendency.
- Less powerful.
- Can be done on small sample size.
- Can use non-random data.
- Applies to variable and attribute.
What is Compared
-
What stats do we use:
- Parametric Tests: Mean and Standard Deviation (SD)
- Non-parametric Tests: Median, Mode, Percentile
- Categorical Data: Counting and Proportions
-
Mean of test to known mean:
- Parametric Tests: t-test
- Non-parametric Tests: Wilcoxon
- Categorical Data: Chi-square
-
2 different groups:
- Parametric Tests: Unpaired t-test
- Non-parametric Tests: Mann-Whitney
- Categorical Data: Chi-square or Fisher
-
2 paired groups:
- Parametric Tests: Paired t-test
- Non-parametric Tests: Wilcoxon
- Categorical Data: McNemar
-
≥ 3 groups:
- Parametric Tests: ANOVA
- Non-parametric Tests: Kruskal-Wallis
- Categorical Data: Chi-square
-
Regression:
- Parametric Tests: Linear Regression
- Non-parametric Tests: Nonparametric Regression
- Categorical Data: Logistic Regression
Bias
Types of Bias
- Selection Bias: Systematic differences between baseline characteristics of groups.
- Sequence generation.
- Allocation concealment.
- Performance Bias: Systematic differences in care provided.
- Blinding of participants and personnel.
- Other threats to validity.
- Detection Bias: Systematic differences in outcome determination.
- Blinding of outcome assessment.
- Other threats to validity.
- Attrition Bias: Systematic differences in withdrawals.
- Incomplete outcome data.
- Reporting Bias: Systematic differences in reported and unreported findings.
- Selective outcome reporting.
Techniques to Avoid Bias
- Randomisation of subjects.
- Blinding of subjects and investigator.
- Monitoring of clinical trials.
- Checking original source documents.
- Source data verification.
- Clinical data management.
- Quality control (QC) and Quality assurance (QA) procedures.
Pragmatism
Nine Dimensions for Assessing the Level of Pragmatism in a Trial (PRECIS-2 Tool)
Recruitment of Investigators and Participants
- Eligibility: To what extent are the participants in the trial similar to patients who would receive this intervention if it was part of usual care?
- Recruitment: How much extra effort is made to recruit participants over and above what would be used in the usual care setting to engage with patients?
- Setting: How different are the settings of the trial from the usual care setting?
The Intervention and Its Delivery within the Trial
- Organization: How different are the resources, provider expertise, and organization of care delivery in the intervention group of the trial from those available in usual care?
- Flexibility in Delivery: How different is the flexibility in how the intervention is delivered from the flexibility anticipated in usual care?
- Flexibility in Adherence: How different is the flexibility in how participants are monitored and encouraged to adhere to the intervention from the flexibility anticipated in usual care?
The Nature of Follow-up
- Follow-up: How different is the intensity of measurement and the follow-up of participants in the trial from the typical follow-up in usual care?
The Nature, Determination, and Analysis of Outcomes
- Primary Outcome: To what extent is the primary outcome of the trial directly relevant to participants?
- Primary Analysis: To what extent are all data included in the analysis of the primary outcome?
Phases of Clinical Trail
Phase I: Checking for Safety
- Sample: 10-20 healthy volunteers
- Objective: Unexpected side effects may occur
Phase II: Checking for Efficacy
- Sample: About 200 patients
- Objective: Most research projects fail in Phase II due to the product not being as effective as anticipated
Phase III: Confirm Findings in Large Patient Population
- Sample: More than 1,000 people
- Objective: Likelihood to detect rare side effects increases with the number of people involved
Phase IV: Testing Long-term Safety in Diverse Patient Population
- Sample: “Real life patients” – testing being carried out outside of clinical environment (post-marketing studies)
- Objective: Previously untested groups may show adverse reactions
Links
Past Exam Questions
Clinical Audit on Unintentional Extubation in ICU
Explain the process and goals involved in a Clinical Audit that would be used to investigate an increased incidence of unintentional extubation on your multi-disciplinary intensive care unit. Use diagrams to describe the processes involved. (10)
References:
- Some stats principles you need to know. Ernest Welch Dunkeld Anaesthetic Practice
- Scally, A. J. (2014). A practical introduction to medical statistics. The Obstetrician &Amp; Gynaecologist, 16(2), 121-128. https://doi.org/10.1111/tog.12081
- Rowntree, Derek (2018) Statistic without Tears. Penguin Books: London
- FRCA Mind Maps. (2024). Retrieved June 5, 2024, from https://www.frcamindmaps.org/
Copyright
© 2025 Francois Uys. All Rights Reserved
id: “6b7507b4-201f-4d75-856f-08948af9d604”