{}
Critical Appraisal
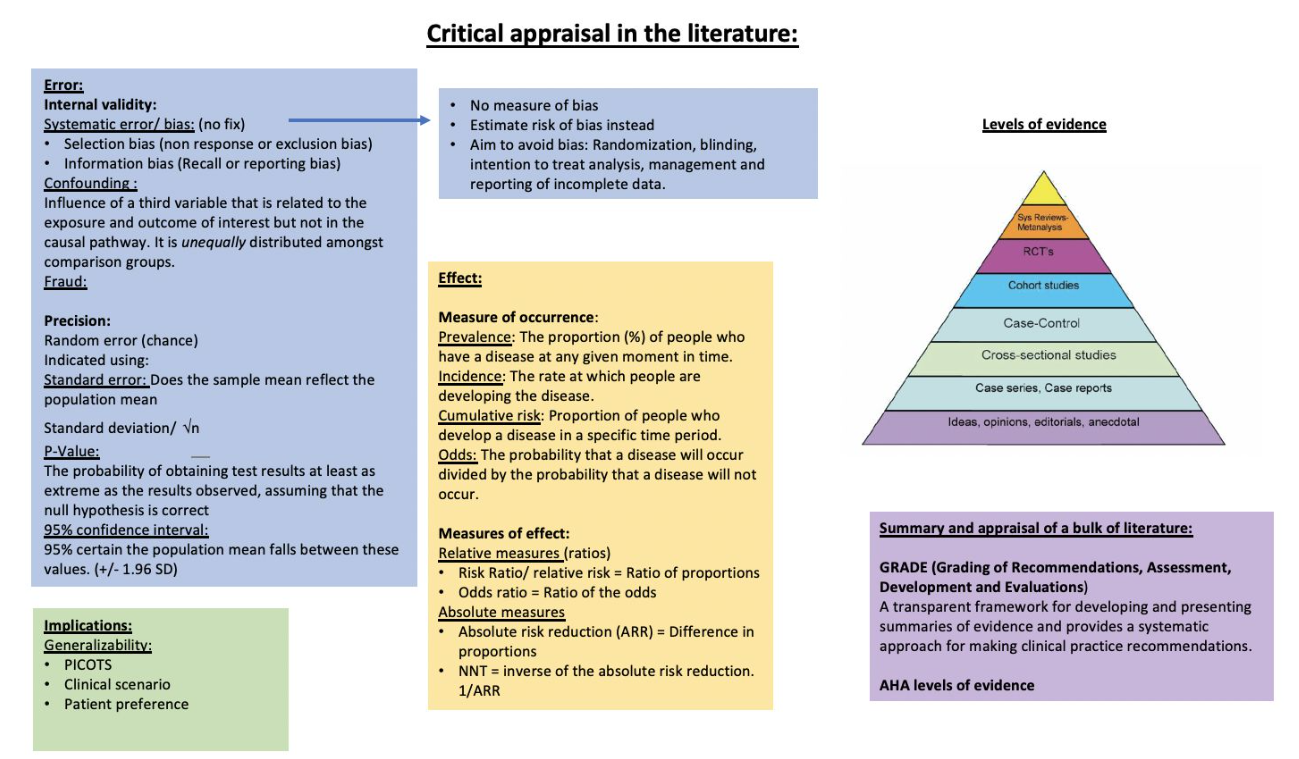
Epidemiological Terms
Prevalence
- Definition: The proportion (%) of people who have a disease at any given moment in time.
Incidence
- Definition: The rate at which people are developing the disease.
Cumulative Risk
- Definition: The proportion of people who develop a disease in a specific time period.
Odds
- Definition: The probability that a disease will occur divided by the probability that a disease will not occur.
How to Read an Article
Editorials
- Importance: Editorials are significant contributions to the academic content of journals.
- Peer Review: Most editorials in quality journals are peer-reviewed, though the level of peer review is often lower than that for investigative articles due to their nature as invited commentaries.
- Function: They highlight important issues and provide valuable guides to current thinking, particularly in controversial areas, offering useful summaries.
Investigative Articles
- Structure: Investigative articles are typically structured into well-recognized sections:
- Summary
- Introduction
- Methods and Materials
- Results
- Discussion
- References
Probability
- Scientific Process Logic: The scientific process often involves testing assumptions indirectly. If a theorem cannot be proven directly, the safer strategy is to assume that the theory is not true and then test that assumption.
- This is referred to as the Null Hypothesis (H0).
- The stated theorem is referred to as the Alternative Hypothesis (H1).
- Statistical Analysis: The purpose of statistical analysis is to assist in deciding whether or not to accept the null hypothesis. Since proving a theory beyond any doubt is uncommon, a level of probability is set to test the theory to a level of “reasonable” doubt, typically at 5% (p < 0.05). This acceptable doubt level is known as the alpha value (α) and must be fixed prior to commencing an investigation.
- α Error: Setting the alpha level at 0.05 implies a 95% certainty that the data were not the result of random events, but also a 1:20 risk that the results were due to chance. This risk is referred to as α error.
- Type 2 or β Error: A more subtle error occurs when the null hypothesis is accepted as the true state of affairs, but in reality, a genuine difference exists. This is usually due to an inadequate sample size and is referred to as a Type 2 or β error.
- Minimizing β Error: This can be minimized by power analysis, where the sample size is calculated based on pre-existing assumptions of the magnitude of the effect being examined and the clinical relevance of the effect size.
Data and Descriptive Statistics
Interval
- Discrete
- Definition: Data measured on an integer scale only (whole numbers)
- Examples: Parity, number of teeth
- Continuous
- Definition: Data measured with a constant scale interval, but not with an absolute zero
- Examples: Body temperature, airway pressure
- Ratio
- Definition: Continuous data related to an absolute zero
- Examples: Kelvin, barometric pressure
Categorical
- Ordinal
- Definition: Ordered data but without a constant scalar interval
- Examples: Scoring systems
- Nominal
- Definition: Qualitative data that can be ordered or ranked
- Examples: Any kind of category or grouping
- Dichotomous
- Definition: Binary data
- Examples: Mortality, gender
Hypothesis Testing
Purpose
- The purpose of hypothesis testing is to allow an experimenter to make a choice regarding the validity of the data collected in relation to the original hypothesis.
- The nature of the data collected determines the statistical technique to be applied.
- The basic ethical principle of medical research is to study the smallest number of subjects possible to minimize harm. Therefore, the most powerful and robust test available should always be used.
Types of Tests
- Parametric Statistics: Typically used for interval data as they require fewer samples to demonstrate statistical significance.
- Student’s t-test: Used when comparing two sample means.
- Analysis of Variance (ANOVA): Used when considering multiple samples.
- Rule for Parametric Tests: Data must be normally distributed.
Data Types and Appropriate Statistical Tests
Normal Distribution
- Single Comparison, Two Related Groups
- Test: Paired t-test
- Single Comparison, Two Unrelated Groups
- Test: Unpaired t-test
- Multiple Sample Groups
- Test: ANOVA
- Multiple Comparisons Over Time
- Test: ANOVA for repeated measures
Non-Normal Data
- Ordinal
- Single Comparison, Two Related Groups
- Test: Wilcoxon signed rank test
- Single Comparison, Two Unrelated Groups
- Test: Mann-Whitney U-test
- Single Comparison, Two Related Groups
- Nominal
- Small Numbers, Single Group Comparison
- Test: Fisher’s Exact test
- Multiple Groups, Large Numbers
- Test: Chi-square test
- Small Numbers, Single Group Comparison
Student’s t-Test
- Paired t-test: Used when data is obtained from a single subject tested twice under different conditions to minimize sampling variability.
- Unpaired t-test: Used when data is obtained from different individuals under different conditions.
- Probability Value: Calculated for a given number of degrees of freedom for a single comparison.
- Multiple Comparisons: The likelihood of error increases with the number of comparisons. Use the Bonferroni correction or a more robust technique for multiple comparisons.
ANOVA
- Purpose: Examines the variability within samples to determine if they arise from a single dataset.
- Forms: Multiple forms of ANOVA are available depending on the comparisons and data format.
- Post-hoc Testing: Conducted after ANOVA demonstrates a real difference within the dataset.
Non-Parametric Tests
- Usage: For data not normally distributed and categorical information.
- Analogous Tests:
- Signed Rank Test: Equivalent to paired t-test.
- Mann-Whitney U-test: Equivalent to unpaired t-test.
- Kruskal-Wallis ANOVA: For multiple comparisons of non-parametric data.
- Categorical Data:
- Fisher’s Exact Test: Useful for small numbers and 2×2 comparisons.
- Chi-square Test: For larger and multiple comparisons.
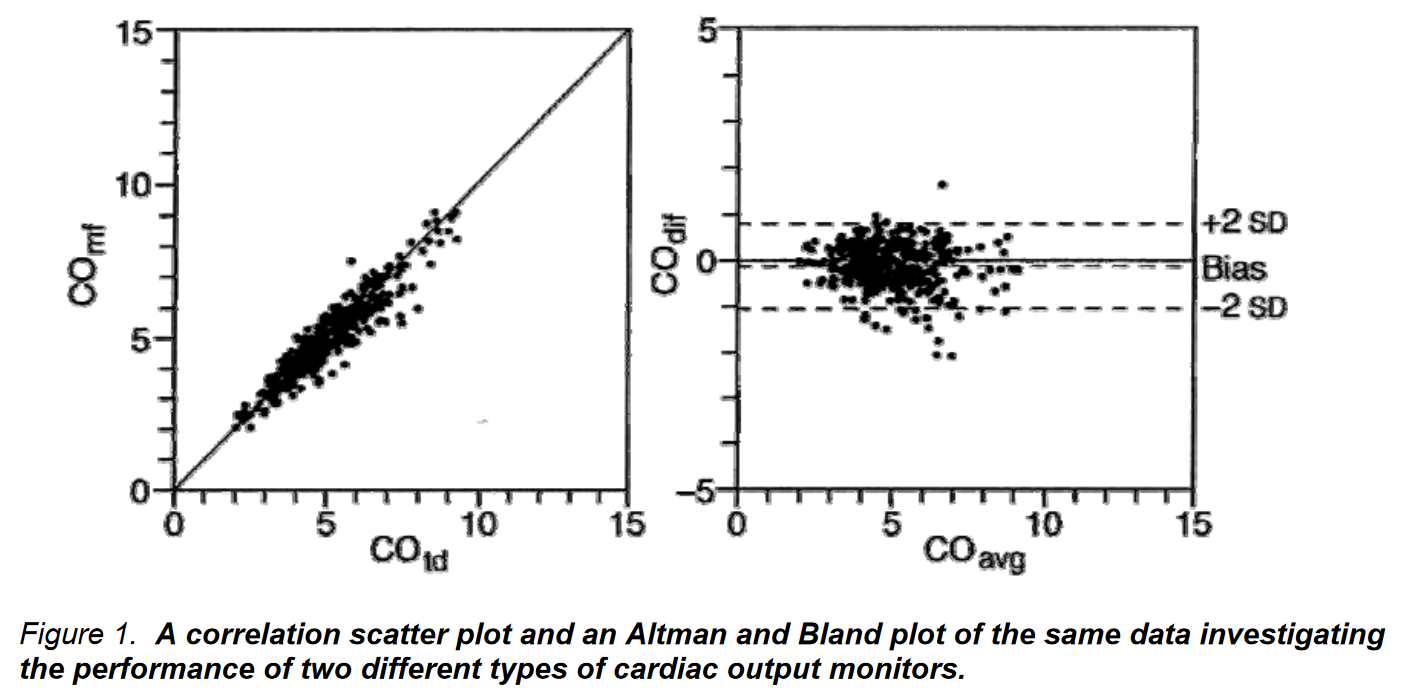
Altman and Bland Method
- Purpose: Tests the comparability of two devices measuring similar clinical values.
- Method: Simultaneous measurements using both devices, plotting the average measurement against the difference between the two measurements.
- Scatter Plot Values:
- Bias or Offset: Averaging the differences, ideally close to 0.
- Standard Deviation of Differences: Establishes “limits of agreement” as 2 SD from the mean.
- Interpretation: Indicates the range within which the two devices agree, rather than the probability of sameness.
- Advantage: More robust than correlation and regression methods.
Results
- The Boldt fraud was detected because the presented results were unrealistic and could not have been achieved with the methodology used.
- It is important to assess whether or not the authors have excluded any patients or data records and, if so, how those exclusions were handled. Most journals now require a CONSORT diagram.
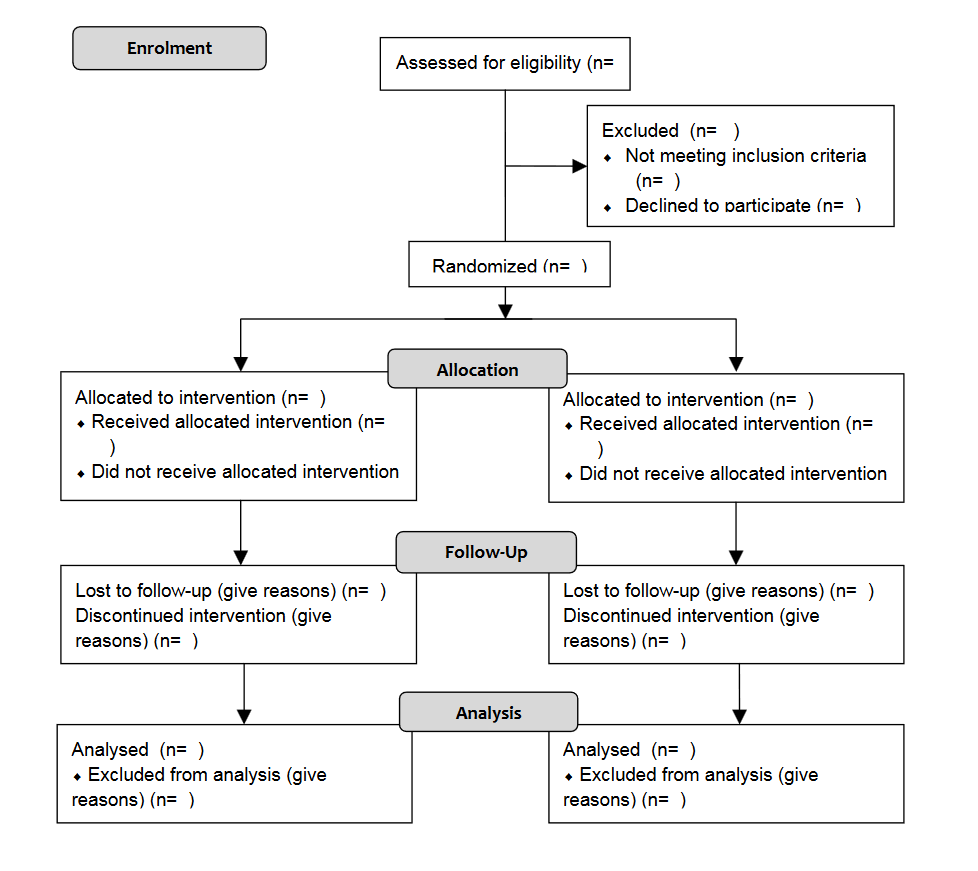
- CONSORT stands for Consolidated Standards of Reporting Trials. It encompasses various initiatives developed by the CONSORT Group to alleviate problems arising from inadequate reporting of randomized controlled trials.
- Intention-to-treat analysis means that any patient who is randomized should be included in the analysis. However, circumstances may arise that make such all-inclusive data analysis impossible.
- Sometimes, an interesting observation may turn out to be statistically significant by chance. It is acceptable to report such a finding as an observation requiring future investigation, but it may not be reported as a conclusion.
Discussion
- The discussion should summarize the results and place them in the context of clinical practice and the original hypothesis.
- Conclusions drawn must be justified by both the methods and the statistical analysis of the results.
Systematic Reviews and Meta-Analysis
-
In a systematic review, data are obtained from all randomized controlled trials (RCTs) addressing a single research question. Researchers follow a structured protocol, including:
- Definitions of study inclusion/exclusion criteria.
- Explicitly defined literature search strategies.
- Techniques for extracting data.
- Appraisal of data quality.
- Systematic pooling of data.
-
If the collected data are consistent, results are combined using meta-analysis techniques. Binary outcomes (e.g., yes/no, alive/dead) are analyzed using either an odds ratio (OR) or relative risk (RR) analysis.
-
Results are presented as a Forest plot.
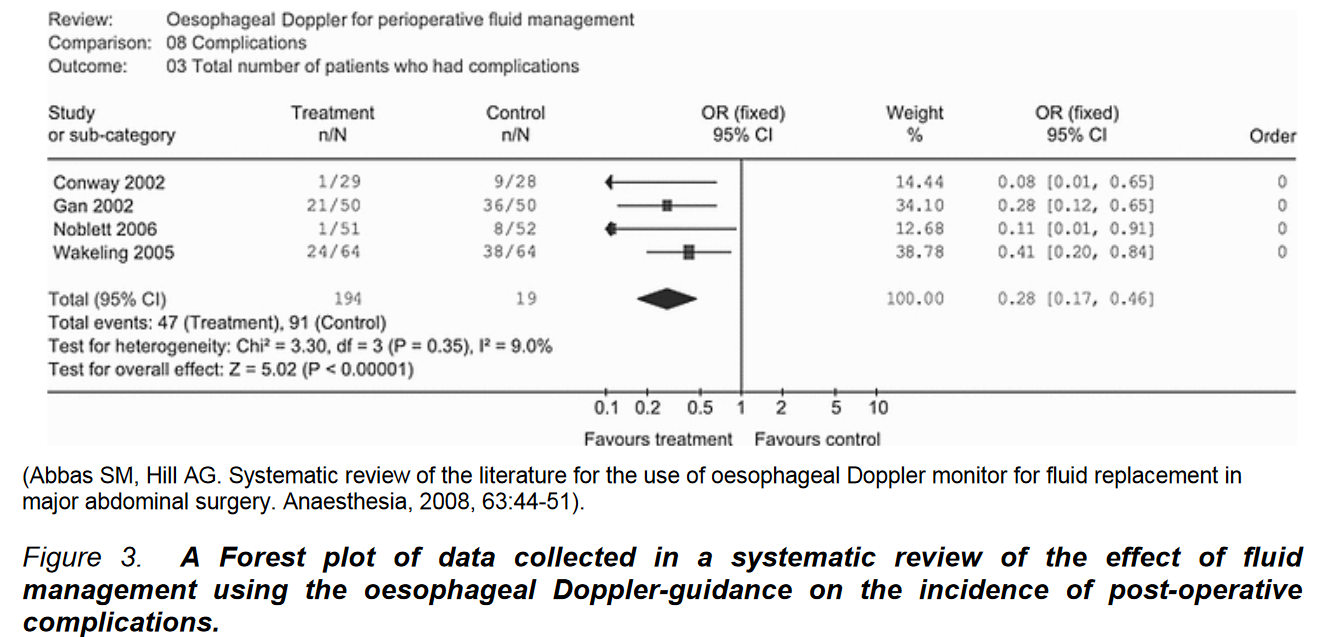
Forest Plot Interpretation
- Studies Included: The far-left column lists the included studies, followed by the incidence of the effect in treatment and control groups.
- Treatment Effect Range: Horizontal lines under the “OR” column indicate the range of treatment effect for each study. Boxes show the median value (odds ratio) and a 95% confidence interval (CI).
- Overall Analysis: A diamond at the bottom of the OR column represents the overall effect and CI.
- Weighting: Next columns provide the weighting for each study (based on data quality, number of patients/events), followed by the OR and 95% CI for each study.
- Odds Ratio (OR) Interpretation:
- OR of 1: No difference between treatment and control groups.
- If 95% CI includes 1: No significant difference.
- Test for heterogeneity: Indicates consistency of collated information. Significant heterogeneity weakens meta-analysis validity.
- Quantitative Data: Occasionally, a Forest plot may include quantitative data (e.g., volume of fluid needed). Researchers present the weighted mean difference (WMD) between groups, with a line of equivalence value of zero (instead of unity for OR).
- Example Analysis:
- Study Focus: Use of oesophageal Doppler techniques for fluid management and its impact on postoperative complications.
- Conclusion: Significant treatment effect with a 72% mean reduction in complication likelihood in the treatment group (OR 0.28, CI 0.17-0.46). CI not including unity indicates statistical significance (p=0.35).
- Quality Limitation: Meta-analysis data quality is dependent on the quality of original studies. Meta-analysis results are for hypothesis generation, not conclusive evidence.
- Number Needed to Treat (NNT):
- Calculated from meta-analyses or large single studies.
- Indicates the number of patients needed to treat to achieve a benefit or the number at risk of harm.
- Dependent on event frequency and treatment effectiveness.
Interpretation
Internal Validity
- Results should logically follow from methods.
- Results must be coherent and consistent within the study.
- Single statistically significant results unsupported by other data are problematic.
External Validity
- Assess the transferability of results to other situations.
- Determine if results are specific to the study’s circumstances or generalizable.
Designing a Clinical Trail
Introduction
Designing a clinical trial involves several key steps:
- Original Idea: Developing an idea starts with an observation and forming a hypothesis to explain it.
- Study Population: Identify a suitable population that represents the problem.
- Sample Selection: Define how to draw a sample from the population.
- Data Collection: Determine the data to be collected.
- Endpoints: Define the study endpoints before starting.
- Sample Size: Estimate the number of patients required to reach the endpoints.
Getting Your Idea
The most useful source for a basic idea is your current working environment. Reading extensively is also crucial, as textbooks may contain errors or incompletely expressed issues that could provide research material. Once you have an idea, formulate a problem statement.
Problem Statement
A problem statement is a clear and concise statement defining your observation and the research problem it generates. It should outline the steps to achieve a solution.
SMART Criteria
The SMART test ensures the robustness of your project:
- S: Specific – The project must be clear and focused.
- M: Measurable – Define what you will measure.
- A: Achievable – Ensure the project is feasible.
- R: Relevant – The results must be pertinent to the problem.
- T: Testable – The project should be replicable by others.
Literature Review
A thorough literature review is essential to understand what other scientists have written on the subject. This step helps in identifying gaps in knowledge and refining your research question.
Clinical Research Types
Longitudinal Studies
-
Prospective Studies:
- Subjects are studied over time, forming cohorts.
- Subjects undergo a deliberate intervention, and outcomes are examined.
- Best designs use concurrent controls:
- Comparator intervention: Standard care at the time.
- Placebo control: Used when ethical (e.g., not ethical in post-operative pain without analgesia).
-
Historical Controls:
- Used when new therapy is introduced as superior to previous standards.
- Susceptible to other influencing factors, making it less reliable.
-
Observational Studies:
- Patients receive a treatment, and outcomes are observed for efficacy.
- Useful for new therapies but considered a weak research method.
-
Retrospective Case-Control Studies:
- Previously collected information is compared between groups.
- Attempts to match similar subjects in each group.
- Provides useful information quickly, but is a weak methodology.
- May offer data for power analysis in subsequent studies.
Cross-Sectional Studies
- Usage: Widely used in public health to obtain a snapshot of the current situation.
- Example: Establishing current HIV incidence to assess future impact of AIDS programs.
- In anesthesia: Assessing the quality of post-operative pain relief in an institution.
- Value: Establishes current disease states or efficacy of current practices across various disciplines.
Potential Problems
- Accuracy and Precision: Develop an estimate of the accuracy and precision of the data to be collected.
- Subject Identification:
- Crucial to avoid bias.
- Ensure fair, random selection from the identified pool.
- Avoiding Bias: Critical to select subjects fairly to avoid accusations of bias from selective criteria.
- Limitations:
- Identify and document potential study limitations.
- Helps in further defining methodology.
- Provides information to the Ethics Committee about potential research limitations.
Designing a Randomised Controlled Trial (RCT)
Randomization
- Purpose: Ensure all members of the experimental and control groups have an equal chance of allocation.
- Methods:
- Random Numbers: Use random numbers for randomization.
- Single Block: Suitable for small studies.
- Bites/Blocks: For larger studies to prevent unequal group sizes.
- Coin Flip: Acceptable for small, simple studies without major blinding.
- Sealed Envelopes: Another acceptable method.
Blinding
- Single-Blind: Participants unaware of their group allocation, but researchers know.
- Issues: Necessary in some cases (e.g., ethical concerns with placebo).
- Solutions: Use blinded data capture personnel or objective endpoints.
- Double-Blind: Both participants and researchers unaware of group allocations.
- Advantage: Reduces observer bias, leading to more reliable data.
Statistical Plan
- Pre-Data Collection: Develop an outline statistical plan before starting data collection.
- Consult a Statistician: Recommended to design a suitable statistical plan based on data types.
Determine Your Data Types
Categorical Data
- Nominal/Binary:
- Analyzed using Fisher’s exact test for small groups or a single comparison.
- For more complex analysis, use Chi-Square (X²) test.
Ordinal Data
- Found in scoring systems (e.g., pain scores, ASA, APGAR).
- Tests:
- Mann-Whitney (for 2 groups).
- Kruskal-Wallis ANOVA (for multiple groups).
- Use these tests for non-normally distributed numerical data.
Numerical Data
- Examples: Blood pressure, heart rate, temperature.
- Tests:
- Student’s t-test (for two groups).
- ANOVA (for multiple comparisons).
Power Analysis
- Purpose: Estimate the number of subjects needed for statistically significant results.
- Conducted by: Expert statistician.
- Requirements:
- Estimate the effect size.
- Likely data scatter (standard deviation or 95% CI).
- Information from pilot trials or similar studies in literature.
- Ethics Committee: Requires an acceptable power analysis to minimize subject exposure.
Summary of How to Write a Research Proposal
- Introduction and Statement of Purpose
- Background
- Clinical context
- Literature review
- Research question
- Aims and Objectives
- Method
- Design
- Setting
- Sampling
- Inclusion/Exclusion criteria
- Outcome assessment
- Data collection
- Sample size
- Power calculation
- Methodological Challenges
- Bias
- Loss to follow-up
- Feasibility
- Recruitment
- Study team
- Centres
- Funding
- Ethics
- Study Significance
Research Vs Audit
Clinical Audit
- Aim: How close is current practice to best practice?
- Improves: Healthcare service
- Carried out by: Members of the multidisciplinary team
- Approach: Practice-based
- Duration: An ongoing process
- Experimental Treatment or Placebo: Never involves an experimental treatment or placebo
Research
- Aim: What is best practice?
- Improves: Knowledge
- Carried out by: Usually specific researchers
- Approach: Theory-driven
- Duration: A one-off project
- Experimental Treatment or Placebo: May involve an experimental treatment or placebo
Epidemiological Evidence
- Criteria is used to establish a causal relationship in epidemiological evidence
Bradford Hill Criteria
- Temporality: Does the cause precede the effect?
- Plausibility: Is the association consistent with existing knowledge?
- Consistency: Have similar results been shown in other studies?
- Strength: What is the strength of association between the cause and effect?
- Dose/Response: Does increased exposure = increased effect?
- Reversibility: Does removal of a cause decrease the risk of the effect?
- Study Design: Is the evidence based on a robust study design?
- Evidence: How many lines of evidence lead to the conclusion?
Additional Considerations:
- Temporal Relationship: Exposure to the factor must occur before the disease develops.
- Strength of the Association: Measured by the relative risk.
- Dose-Response Relationship: As the dose of exposure increases, the risk of disease also increases.
- Replication of the Findings: If the relationship is causal, it should be consistently found in different studies and populations.
- Biologic Plausibility: Must be explainable through biological processes.
- Consideration of Alternate Explanations: Other factors should be considered and ruled out.
- Cessation of Exposure: Reduction or elimination of disease incidence should occur if the exposure is removed.
- Consistency With Other Knowledge: The findings should align with existing knowledge.
- Specificity of the Association: When a certain exposure is associated with only one disease.
PICOT
A PICOT statement is a structured framework used to formulate a well-defined clinical research question. The acronym PICOT stands for:
- P (Population/Patient): The specific group of patients or population of interest.
- I (Intervention): The treatment, procedure, or exposure being considered.
- C (Comparison): The alternative intervention or standard of care.
- O (Outcome): The expected result or effect of the intervention.
- T (Time): The timeframe over which the outcomes will be measured (optional).
Usefulness In Applying Research to Practice
- Guides Evidence-Based Practice (EBP): PICOT helps clinicians formulate focused, answerable clinical questions, making it easier to search for relevant research.
- Improves Literature Searches: A structured question using PICOT terms enhances database searches, ensuring relevant studies are identified efficiently.
- Enhances Critical Appraisal: It allows healthcare professionals to compare interventions and assess the strength of the evidence before applying findings to patient care.
- Facilitates Clinical Decision-Making: By clearly defining key components, PICOT helps translate research into practical, patient-centered care.
- Supports Quality Improvement: It aids in designing research studies and protocols that improve patient outcomes by focusing on specific, measurable clinical questions
Links
Past Exam Questions
PICOT Statement and Its Application in Practice
What is meant by a “PICOT” statement and how is this approach useful when applying new research to your practice? (10)
Comparison of Narrative Reviews and Systematic Reviews
Complete the following table, comparing the differences between Narrative Reviews and Systematic Reviews. (10)
| Elements of Review | Narrative Review | Systematic Review |
|---|---|---|
| Scope of clinical or research question | ||
| Protocol | ||
| Source of evidence and search strategy | ||
| Evaluation of evidence | ||
| Synthesis of evidence |
Large Multicentre Randomised Controlled Trials
Discuss the advantages and limitations of large, multicentre, pragmatic randomised controlled trials as evidence in perioperative decision-making. (10)
References:
- Part II Anaesthesia Refresher Course–2016 University of Cape Town 5 How to Read an Article Professor MFM James
- Part II Anaesthesia Refresher Course – 2012 University of Cape Town Designing a Clinical Trial Prof. M James
- Some stats principles you need to know. Ernest Welch Dunkeld Anaesthetic Practice
- Scally, A. J. (2014). A practical introduction to medical statistics. The Obstetrician &Amp; Gynaecologist, 16(2), 121-128. https://doi.org/10.1111/tog.12081
Summaries:
Copyright
© 2025 Francois Uys. All Rights Reserved.
id: “beb283cd-af53-4767-be96-e4e3cb8e91e2”