{}
Flow Volume Loops
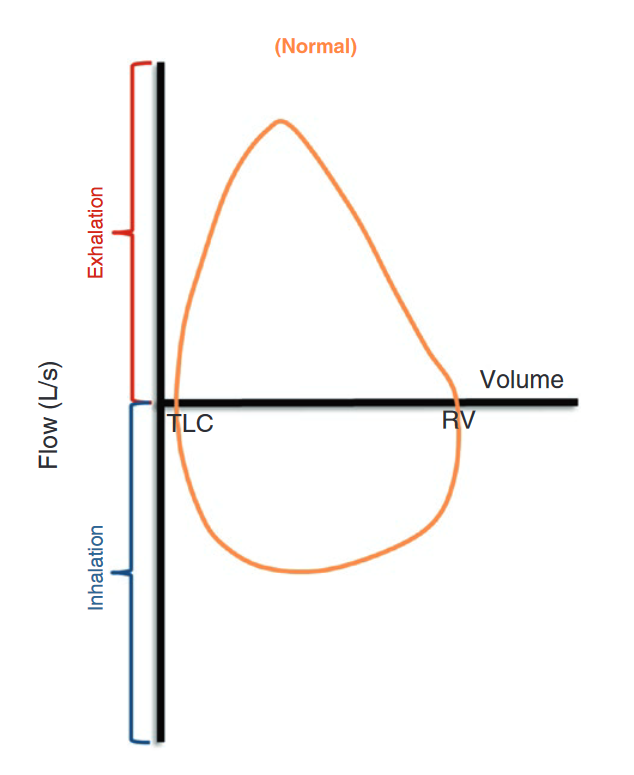
Axes Representation
- Y-axis: Represents the flow rate.
- Exhalation: Above the x-axis.
- Inhalation: Below the x-axis.
- X-axis: Represents lung volume.
- Volume decreases from left to right.
- Starts at total lung capacity (left) and ends at residual volume (right).
Loop Direction
- The flow volume loop begins on the left of the x-axis and follows a clockwise direction.
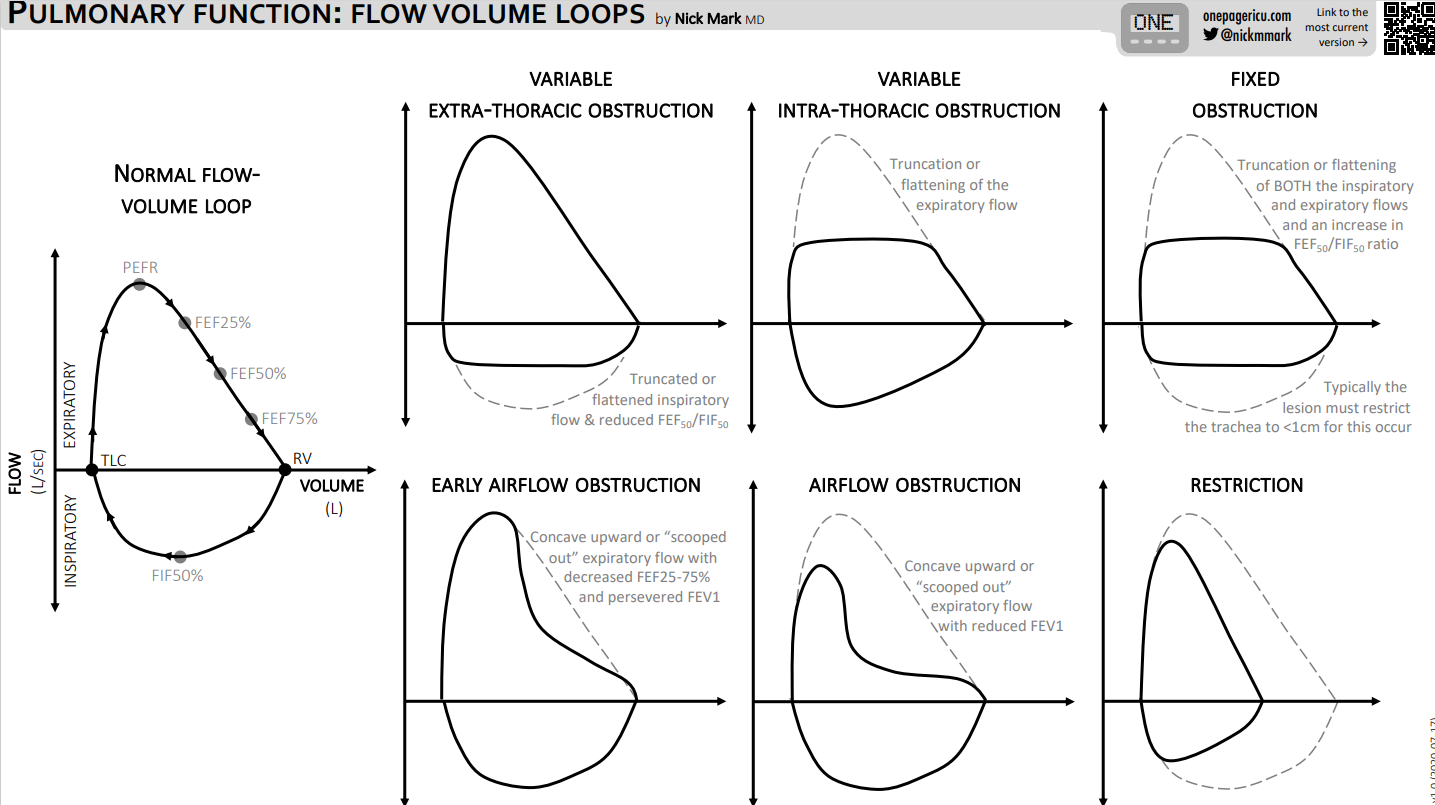
Peak Expiratory Flow Rate (PEFR)
- Normal PEFR:
- Men: Averages between 440 and 740 L/min.
- Women: Averages between 340 and 530 L/min.
- PEFR is located at the highest point on a flow volume loop.
Normal
COPD

- PEFR usually decreases slightly so that the initial expiratory flow is not affected significantly. Instead of the almost linear decrease in expiratory flow, there is a “scooping” of the loop soon after the PEFR. This scooping represents the decreased amount of flow secondary to difficulty in expelling the volume of gases left in the distal airways.
- In severe COPD, the PEFR is affected more drastically. The expiratory flow does not come close to the flow of a normal subject.
Restrictive

Intra Vs Extra Thoracic Obstruction
Intrathoracic obstruction affects expiratory flow
Extrathoracic obstruction affects inspiratory flow

Summary

Links
References:
- Raj, T. D. (2017). Data interpretation in anesthesia.. https://doi.org/10.1007/978-3-319-55862-2
- Ntima, N. and Lumb, A. B. (2019). Physiology and conduct of pulmonary function tests. BJA Education, 19(6), 198-204. https://doi.org/10.1016/j.bjae.2019.02.002
Summaries:
ICU-OP_Flow-volume-loops
Copyright
© 2025 Francois Uys. All Rights Reserved.
id: “926de135-7083-477c-90e0-4ffb63e03872”