{}
Summary of Management of Respiratory Patient

Functional Anatomy
Rib Cage and Muscles of Respiration
Inhalation
- Diaphragm: The diaphragm is the primary muscle of respiration, descending 1.5 to 7 cm during contraction. This movement accounts for 75% of thoracic volume changes, expanding the lungs and increasing thoracic cavity volume.
- Accessory Muscles: External intercostal muscles, sternocleidomastoid, scalene, and pectoralis muscles assist in rib elevation, increasing chest volume.
- Rib Articulation: Ribs articulate posteriorly with vertebrae and angle downward anteriorly. Their upward and outward movement during inhalation expands the thoracic cavity.
- Muscle Contributions: During normal breathing, inspiration is primarily driven by the diaphragm and external intercostal muscles, while expiration is passive. Pharyngeal muscles maintain airway patency.
Exhalation
- Passive Mechanism: Exhalation is typically passive during normal respiration.
- Active Exhalation: Assisted by abdominal muscles (rectus abdominis, external/internal obliques, transversus) and internal intercostal muscles, which facilitate rib depression.
Tracheobronchial Tree
- Trachea: Extends from the cricoid cartilage to the carina, averaging 10–13 cm in length, with C-shaped cartilaginous rings and a membranous posterior wall.
- Bronchi: The trachea bifurcates at the sternal angle into the right and left mainstem bronchi. The right bronchus is straighter, while the left is more angular.
- The right mainstem bronchus forms the bronchus intermedius after the right upper lobe bronchus branches.
- The left mainstem bronchus divides into left upper and lower lobe bronchi.
- Function: The tracheobronchial tree filters and humidifies inspired air and conducts gas through ~23 divisions to the alveoli.
Histology
- Epithelium Transition: Ciliated columnar epithelium transitions to cuboidal and ultimately to alveolar epithelium for gas exchange.
- Structural Changes: Cartilage support disappears at bronchioles, with airway patency depending on surrounding tissue’s elastic recoil.
- Cilia: Synchronous beating of cilia moves mucus and debris toward the oropharynx.
Alveoli
- Size Variation: Alveolar size varies with gravity and lung volume, being largest at the pulmonary apex in upright individuals.
- Gas Exchange: Occurs across the thin side of the alveolocapillary membrane (<0.4 μm), while the thick side provides structural support.
- Pneumocytes:
- Type I: Form tight junctions to prevent large molecule passage.
- Type II: Produce surfactant and can regenerate type I cells.
- Other Cells: Include macrophages, mast cells, lymphocytes, APUD cells, and neutrophils (in smokers or during lung injury).
Circulation and Lymphatics
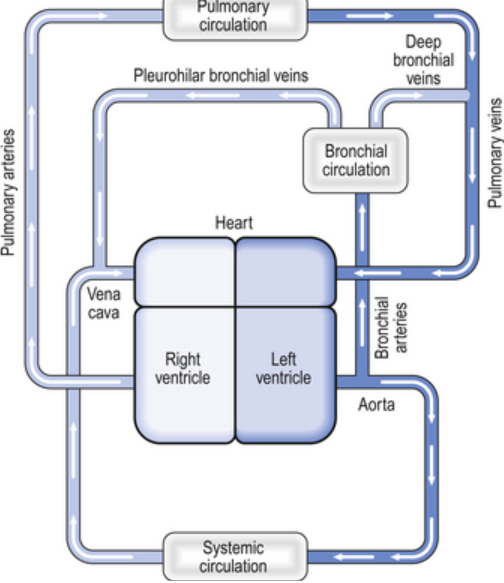
- Pulmonary and Bronchial Circulations:
- The bronchial circulation, originating from the thoracic aorta, nourishes the tracheobronchial tree.
- The pulmonary circulation supports alveolar gas exchange with the entire right heart output.
- Capillaries: Integrated into alveolar walls, allowing single red cell passage. Blood flow depends on gravity and alveolar size.
- Lymphatics: Drain interstitial fluid, proteins, and cells into the bloodstream. Lymph travels alongside airways and forms tracheobronchial lymph nodes.
Innervation
- Diaphragm: Motor and sensory innervation via the phrenic nerves (C3–C5). Peripheral sensory innervation by intercostal nerves (T6–T11).
- Tracheobronchial Tree: Sensory innervation by the vagus nerve.
- Parasympathetic activity induces bronchoconstriction and increases secretion.
- Sympathetic activity causes bronchodilation and reduces secretion.
- Vascular Innervation:
- Sympathetic stimulation (T1–T4) activates β2-receptors for bronchodilation.
- Parasympathetic activity mediates vasodilation via nitric oxide.
Mechanism of Breathing
- Gas Exchange: Fresh upper airway gas replenishes oxygen and eliminates CO₂ via alveolar exchange. This process depends on small cyclic pressure gradients.
- Pressure Gradients: During spontaneous breathing, intrathoracic pressure changes drive ventilation. In mechanical ventilation, positive airway pressure creates these gradients.
Spontaneous Ventilation
- Pressure Changes: Intrapleural pressure decreases during inspiration, facilitating airflow into the lungs. At end-inspiration, alveolar pressure equals atmospheric pressure, and intrapleural pressure is ~−8 to −9 cm H₂O.
- Transpulmonary Pressure: The difference between alveolar and intrapleural pressure drives lung expansion.
Lung Mechanics
- Passive Movement: Governed by respiratory system impedance, divided into elastic and nonelastic resistance.
Elastic Resistance
- Chest Wall and Lung Properties:
- The chest tends to expand outward, while the lungs tend to collapse inward.
- Elastic recoil arises from the chest wall’s structural components and muscle tone, and the lungs’ elastin fibers and surface tension.
- Surface Tension: Alveoli behave like bubbles, with surfactant reducing surface tension proportional to concentration, stabilizing alveolar size.
Compliance
- Definition: Elastic recoil measured as the change in volume divided by the change in distending pressure.
- Lung Compliance (CL): Affected by lung volume, blood volume, extravascular lung water, and pathological processes. Normal CL is 150 to 200 mL/cm H2O.
- Chest Wall Compliance (CW): Reduced in the supine position due to abdominal contents’ weight. Total compliance (lung and chest wall) is expressed by 1/Ctotal = 1/CW + 1/CL, with normal chest wall compliance being 200 mL/cm H2O and total compliance being 100 mL/cm H2O.
Lung Volumes
| Measurement | Definition | Average Adult Values (mL) |
|---|---|---|
| Tidal volume (VT) | Each normal breath | 500 |
| Inspiratory reserve volume (IRV) | Maximal additional volume that can be inspired above VT | 3000 |
| Expiratory reserve volume (ERV) | Maximal volume that can be expired below VT | 1100 |
| Residual volume (RV) | Volume remaining after maximal exhalation | 1200 |
| Total lung capacity (TLC) | RV + ERV + VT + IRV | 5800 |
| Functional residual capacity (FRC) | RV + ERV | 2300 |
Functional Residual Capacity (FRC)
- Definition: FRC is the lung volume at the end of normal exhalation.
- It represents the balance between the inward elastic recoil of the lungs and the outward elastic recoil of the chest wall, including diaphragmatic tone.
- The elastic properties of the lungs and chest define the starting point for normal breathing.
- FRC can be measured using nitrogen washout, helium wash-in techniques, or body plethysmography.
Factors Influencing FRC
- Body Habitus:
- FRC is directly proportional to height.
- Obesity significantly reduces FRC due to decreased chest wall compliance and increased abdominal pressure on the diaphragm.
- Kyphosis adversely impacts lung volumes and rib mobility.
- Sex:
- FRC is approximately 10% lower in females compared to males.
- Increased Intra-Abdominal Pressure:
- Conditions like laparoscopic surgery, pregnancy, or ascites reduce FRC by increasing diaphragmatic pressure.
- Posture:
- Moving from an upright to a supine or prone position reduces FRC, particularly between 0° and 60° inclination.
- Abdominal contents compress the diaphragm, reducing chest wall compliance.
- Lung Disease:
- Restrictive pulmonary disorders reduce lung and/or chest compliance, leading to low FRC.
- Diaphragmatic Tone:
- Diaphragmatic tone contributes to FRC, with reduced capacity evident in unilateral or bilateral phrenic nerve paralysis.
Closing Capacity
- Definition: The lung volume at which the smallest airways (respiratory bronchioles) collapse.
- Airways without cartilage rely on radial traction from surrounding tissue to remain open.
- At low lung volumes, alveoli in dependent lung areas collapse, resulting in perfusion without ventilation (intrapulmonary shunting), leading to hypoxemia.
Measurement
- Involves inhalation of 100% oxygen near residual volume followed by exhalation from total lung capacity.
- Nitrogen concentration changes in exhaled gas reflect airway closure in dependent alveoli.
- Dependent alveoli close first, as indicated by rising nitrogen concentrations.
Age and Posture Effects
- Closing capacity increases with age, contributing to the age-related decline in arterial O₂ tension.
- By age 44, closing capacity equals FRC in the supine position.
- By age 66, closing capacity equals or exceeds FRC in the upright position.
- Unlike FRC, closing capacity is unaffected by posture but approaches FRC in conditions like morbid obesity.
Vital Capacity (VC)
- Definition: The maximum volume of gas that can be exhaled after maximal inspiration.
Factors Influencing VC
- Body habitus.
- Respiratory muscle strength.
- Chest-lung compliance.
Normal Values
- Approximately 60–70 mL/kg.
Nonelastic Resistances
Airway Resistance to Gas Flow
- Gas Flow Types:
- Laminar Flow: Occurs in concentric cylinders, with maximum velocity at the center.
- Flow Equation: Flow = Pressure / Resistance.
- Resistance depends on gas viscosity and airway radius.
- Turbulent Flow: Random movement of gas molecules, influenced by gas density.
- Resistance increases proportionally with gas density and inversely with airway radius to the fifth power.
- Turbulence occurs in high-flow areas, branching points, or abrupt airway diameter changes.
- Laminar Flow: Occurs in concentric cylinders, with maximum velocity at the center.
Reynolds Number
- Definition: Predicts flow type based on gas properties and airway size.
- Laminar Flow: Reynolds number <1000.
- Turbulent Flow: Reynolds number >1500.
- Location:
- Laminar flow typically occurs in small bronchioles (<1 mm).
- Larger airways experience turbulent flow.
- Clinical Application:
- Helium-O₂ mixtures reduce turbulent flow in conditions like upper airway obstruction due to helium’s low density-to-viscosity ratio.
Airway Resistance
- Normal Resistance: Total airway resistance is 0.5–2 cm H₂O/L/s.
- Resistance Contributors:
- Medium-sized bronchi contribute the most resistance before the seventh generation of branching.
- Large bronchi and small bronchioles contribute less due to their large total cross-sectional area.
Volume-Related Airway Collapse
- At low lung volumes, reduced radial traction increases small airway resistance.
- Applying positive end-expiratory pressure (PEEP) increases lung volume, reducing airway resistance.
Gas Flow Dynamics During Forced Exhalation
-
Flow Characteristics:
- Terminal expiratory flow is effort-independent at low lung volumes.
- Dynamic airway compression occurs at the equal pressure point (where airway pressure equals surrounding pressure).
-
Equal Pressure Point:
- Moves toward smaller airways as lung volume decreases.
- Conditions like emphysema (loss of airway support) and asthma (bronchoconstriction) exacerbate airway collapse.
- Patients with dynamic compression may exhibit premature exhalation, air trapping, and auto-PEEP.
Forced Vital Capacity (FVC)
- Measuring FVC:
- Measuring vital capacity as an exhalation that is as forceful and rapid as possible provides important information about airway resistance.
- FEV1/FVC Ratio: The ratio of the forced expiratory volume in the first second of exhalation (FEV1) to the total forced vital capacity (FVC) is proportional to the degree of airway obstruction.
- Normally, FEV1/FVC is 80% or greater.
- Both FEV1 and FVC are effort dependent, but forced mid-expiratory flow (FEF25–75%) is more effort independent and may be a more reliable measurement of obstruction.
Tissue Resistance
- Nonelastic Resistance:
- Often underestimated and overlooked.
- May account for up to half of total airway resistance.
- Primarily due to viscoelastic (frictional) resistance of tissues to gas flow.
Work of Breathing
- General Characteristics:
- Expiration is normally entirely passive.
- Both inspiratory and expiratory work of breathing is accomplished by the inspiratory muscles, primarily the diaphragm.
- Three factors must be overcome during ventilation:
- Elastic recoil of the chest and lung.
- Frictional resistance to gas flow in the airways.
- Tissue frictional resistance.
- Respiratory work can be expressed as the product of volume and pressure.
- During Inhalation:
- Both inspiratory airway resistance and pulmonary elastic recoil must be overcome.
- Nearly 50% of the energy expended is stored in pulmonary elastic recoil.
- During Exhalation:
- Stored potential energy is released, overcoming expiratory airway resistance.
- Increases in inspiratory or expiratory resistance are compensated by increased inspiratory muscle effort.
- When expiratory resistance increases, the normal compensatory response is to increase lung volume so that tidal volume (VT) breathing occurs at an abnormally high functional residual capacity (FRC).
- Greater elastic recoil energy stored at a higher lung volume overcomes the added expiratory resistance.
- Excessive expiratory resistance also activates expiratory muscles.
- Respiratory Muscle Efficiency:
- Normally, respiratory muscles account for only 2% to 3% of O2 consumption, operating at about 10% efficiency.
- Ninety percent of the work is dissipated as heat due to elastic and airflow resistance.
- In pathological conditions that increase the load on the diaphragm, muscle efficiency decreases progressively, and contraction may become uncoordinated with increasing ventilatory effort.
- A point may be reached whereby any increase in O2 uptake, due to augmented ventilation, is consumed by the respiratory muscles themselves.
- Work of Breathing Dynamics:
- The work required to overcome elastic resistance increases as VT increases.
- The work required to overcome airflow resistance increases as respiratory rate (and, necessarily, expiratory flow) increases.
- Patients minimize the work of breathing by altering respiratory rate and VT:
- Patients with reduced compliance tend to have rapid, shallow breaths.
- Patients with increased airflow resistance tend to have a slow, deep breathing pattern.
Effects of Anaesthesia on Pulmonary Mechanics
Effects on Lung Volumes and Compliance
- Initial Changes:
- General anaesthesia reduces lung function shortly after induction.
- FRC decreases by 0.8–1.0 L in the supine position and an additional 0.4–0.5 L after anaesthesia induction.
- Mechanisms of FRC Reduction:
- Alveolar collapse and compression atelectasis result from loss of inspiratory muscle tone, changes in chest wall rigidity, and upward diaphragmatic shift (dependent portion).
- Contributing factors include increased pulmonary blood volume and altered chest wall shape.
- Persistence:
- The decrease in FRC is unrelated to anaesthetic depth and may persist for hours to days post-anaesthesia.
- Effects of Position:
- Trendelenburg position (>30° decline) exacerbates FRC reduction due to increased thoracic blood volume.
- Sitting position has minimal impact on FRC, and muscle paralysis does not significantly alter FRC under anaesthesia.
- Closing Capacity:
- Anaesthesia reduces both FRC and closing capacity, increasing the risk of intrapulmonary shunting, particularly in obese, elderly, or pulmonary-compromised patients.
Effects on Airway Resistance
- FRC and Resistance:
- FRC reduction under general anesthesia may increase airway resistance, but bronchodilation from inhalation agents typically mitigates this.
- Pathological Factors Increasing Resistance:
- Posterior tongue displacement, laryngospasm, bronchoconstriction, airway obstructions (e.g., secretions or tumors), or equipment-related issues like small tracheal tubes or valve malfunctions.
Effects on Work of Breathing
- Mechanisms:
- Increased work of breathing stems mainly from reduced compliance of the lung and chest wall.
- Airway resistance increases contribute less frequently.
- Controlled mechanical ventilation typically alleviates this increased workload.
Effects on Respiratory Pattern
- Changes with Anaesthesia:
- Light anaesthesia leads to irregular breathing, including breath holding.
- Deeper anaesthesia produces regular, rapid, shallow breaths with inhalation agents or slower, deeper breaths with nitrous-opioid techniques.
Effects on Gas Exchange
- Gas Exchange Abnormalities:
- Increased dead space, hypoventilation, and intrapulmonary shunting are common.
- Venous admixture increases to 5–10%, primarily due to atelectasis and airway collapse in dependent lung regions.
- Hypoxic Pulmonary Vasoconstriction Inhibition:
- Agents like inhalation anaesthetics, vasodilators, and inodilators inhibit this mechanism.
- For volatile agents, inhibition occurs at approximately twice the MAC (ED50).
- Age-Related Effects:
- Older adults exhibit greater venous admixture increases, which are partially mitigated by inspired oxygen tensions of 30–40%.
- PEEP Use:
- Positive end-expiratory pressure reduces venous admixture and hypoxemia, provided cardiac output remains stable.
- High Inspired O₂ Concentrations:
- Prolonged administration can lead to atelectasis and shunting (resorption atelectasis), particularly in low V/Q areas ventilated with nearly 100% O₂.
Ventilation-Perfusion Relationships
Ventilation
- Minute Ventilation (MV):
- Total exhaled gas volume per minute: V˙=Respiratory rate×Tidal volume(VT)
- Normal value: ~5 L/min for an average adult at rest.
- Alveolar Ventilation (VA):
- The volume of gas involved in gas exchange per minute: VA=Respiratory rate×(VT−VD)
- VD represents dead space.
Dead Space
- Components:
- Anatomic Dead Space: Gases in non-respiratory airways.
- Alveolar Dead Space: Alveoli not perfused.
- Physiological Dead Space: The sum of anatomic and alveolar dead space.
- Typical Values:
- Anatomic dead space is ~150 mL (or ~2 mL/kg) in the upright position for most adults.
- Influencing Factors:
- Dead space is affected by patient position, ventilation modes, and pathologies such as emboli or airway obstructions.
Factors Affecting Dead Space
| Factor | Effect |
|---|---|
| Posture | |
| Upright | ↑ |
| Supine | ↓ |
| Position of airway | |
| Neck extension | ↑ |
| Neck flexion | ↓ |
| Age | ↑ |
| Artificial airway | ↓ |
| Positive-pressure ventilation | ↑ |
| Drugs—anticholinergic | ↑ |
| Pulmonary perfusion | |
| Pulmonary emboli | ↑ |
| Hypotension | ↑ |
| Pulmonary vascular disease | |
| Emphysema | ↑ |
- Because VT in the average adult is approximately 450 mL (6 mL/kg), VD/VT is normally 33%. This ratio can be derived by the Bohr equation:
VD/VT = (PACO2 – PECO2) / PACO2 - where PACO2 is the alveolar CO2 tension and PECO2 is the mixed expired CO2 tension. This equation is useful clinically if arterial CO2 tension (PaCO2) is used the approximate the alveolar concentration and the CO2 tension in expired air gases is the average measured over several minutes.
Distribution of Ventilation
- Uneven Distribution:
- Alveolar ventilation is unevenly distributed in the lungs, regardless of body position.
- The right lung receives more ventilation than the left lung (53% vs. 47%).
- Lower (dependent) areas of both lungs are better ventilated than upper areas due to a gravitational gradient in intrapleural pressure (transpulmonary pressure).
- Pleural pressure decreases by about 1 cm H2O (becomes less negative) per 3 cm decrease in lung height.
- Alveolar Characteristics:
- Alveoli in upper lung areas are near-maximally inflated due to higher transpulmonary pressure and are relatively noncompliant, undergoing little expansion during inspiration.
- Smaller alveoli in dependent areas have lower transpulmonary pressure, are more compliant, and undergo greater expansion during inspiration.
- Airway Resistance:
- Airway resistance can also contribute to regional differences in pulmonary ventilation.
- Final alveolar inspiratory volume depends on compliance only if inspiratory time is unlimited.
- An excessively short inspiratory time prevents alveoli from reaching expected volume change.
- Alveolar filling follows an exponential function dependent on both compliance and airway resistance.
Time Constants
- Definition:
- Lung inflation can be described by the time constant, τ:
tau = Total compliance x Airway resistance - Regional variations in resistance or compliance can interfere with alveolar filling and cause asynchrony in alveolar filling during inspiration.
- Lung inflation can be described by the time constant, τ:
- Effects of Rapid Breathing:
- Variations in time constants within the normal lung can be demonstrated in individuals breathing at abnormally high respiratory rates.
- Rapid shallow breathing reverses the normal distribution of ventilation, favoring upper (nondependent) areas over lower areas
Pulmonary Perfusion
- General Overview:
- Of the approximately 5 L/min of blood flowing through the lungs, only about 70 to 100 mL at any one time are within the pulmonary capillaries undergoing gas exchange.
- At the alveolar–capillary membrane, this small volume forms a 50 to 100 m² sheet of blood, approximately one red cell thick.
- Capillary Perfusion:
- Each capillary perfuses more than one alveolus, ensuring optimal gas exchange.
- Capillary volume remains relatively constant, but total pulmonary blood volume can vary between 500 mL and 1000 mL.
- Large increases in cardiac output or blood volume are tolerated with little change in pressure due to passive dilation and some recruitment of collapsed pulmonary vessels.
- Small increases in pulmonary blood volume occur during cardiac systole and with each normal (spontaneous) inspiration.
- Posture and Pulmonary Blood Volume:
- A shift from supine to erect decreases pulmonary blood volume (up to 27%).
- Trendelenburg positioning has the opposite effect.
- Changes in systemic capacitance influence pulmonary blood volume.
- Systemic venoconstriction shifts blood from the systemic to the pulmonary circulation, while vasodilation causes a pulmonary-to-systemic redistribution.
- Pulmonary Vascular Tone:
- Local factors are more important than the autonomic system in influencing pulmonary vascular tone.
- Hypoxia is a powerful stimulus for pulmonary vasoconstriction, the opposite of its systemic effect.
- Both pulmonary arterial (mixed venous) and alveolar hypoxia induce vasoconstriction, with the latter being more powerful.
- Hypoxic pulmonary vasoconstriction reduces intrapulmonary shunting and prevents hypoxemia.
- Hyperoxia has little effect on pulmonary circulation in normal individuals.
- Hypercapnia and acidosis have a constrictor effect, while hypocapnia causes pulmonary vasodilation, the opposite of what occurs in the systemic circulation.
Distribution of Pulmonary Perfusion (West Zones)
- General Distribution:
- Pulmonary blood flow is not uniform.
- Dependent areas of the lung receive greater blood flow than nondependent areas due to gravitational gradients.
- Low pressures in the pulmonary circulation allow gravity to significantly influence blood flow.
- Perfusion scanning shows an “onion-like” layering distribution, with reduced flow at the periphery and increased perfusion toward the hilum.
- Alveolar distending pressure is relatively constant across the lung, while pulmonary perfusion pressure varies.
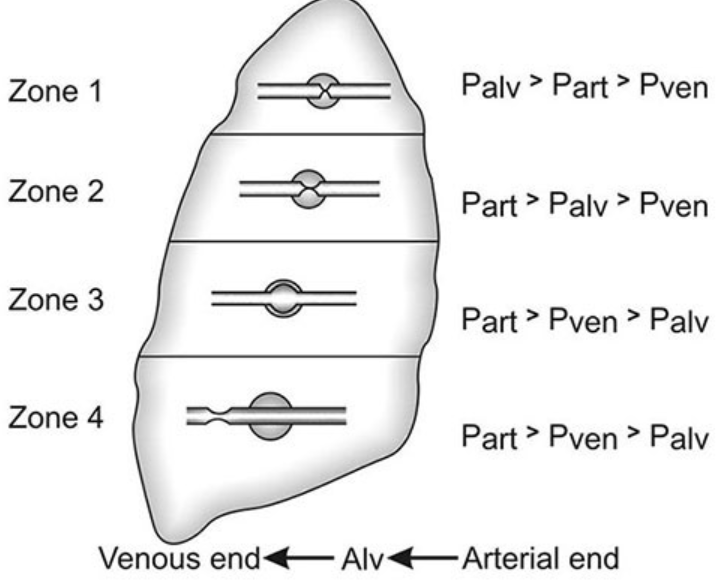
- West Zones of the Lung:
- Zone 1 (PA > Pa > PV):
- Alveolar pressure (PA) exceeds both arterial pulmonary pressure (Pa) and venous pulmonary pressure (PV), resulting in obstruction of blood flow and creation of alveolar dead space.
- Zone 1 is small in spontaneously breathing individuals but can enlarge during positive pressure ventilation.
- Zone 2 (Pa > PA > PV):
- Arterial pulmonary pressure (Pa) exceeds alveolar pressure (PA), but venous pulmonary pressure (PV) is less than both, resulting in blood flow dependent on the differential between Pa and PA.
- Zone 3 (Pa > PV > PA):
- Both arterial and venous pulmonary pressures (Pa and PV) exceed alveolar pressure (PA), resulting in blood flow independent of alveolar pressure.
- Zone 4:
- The most dependent part of the lung, where atelectasis and interstitial pulmonary edema occur, resulting in blood flow dependent on the differential between arterial pulmonary pressure (Pa) and pulmonary interstitial pressure.
- Zone 1 (PA > Pa > PV):
Ventilation-Perfusion Ratio
- Normal Values:
- Alveolar ventilation (AV) is normally about 4 L/min.
- Pulmonary capillary perfusion (Q) is about 5 L/min.
- The overall ventilation-perfusion ratio (V/Q) is approximately 0.8.
- Range of Ratios:
- For individual lung units (each alveolus and its capillary), the ratio can range from 0 (no ventilation) to infinity (no perfusion).
- A ratio of 0 refers to an intrapulmonary shunt.
- A ratio of infinity constitutes alveolar dead space.
- Normally, V/Q ranges between 0.3 and 3.0, with the majority of lung areas close to 1.0.
- For individual lung units (each alveolus and its capillary), the ratio can range from 0 (no ventilation) to infinity (no perfusion).
- Distribution:
- Because perfusion increases at a greater rate than ventilation, nondependent (apical) areas tend to have higher ratios than dependent (basal) areas.
- Physiological Importance:
- The V/Q ratio is crucial for the efficiency with which lung units resaturate venous blood with O2 and eliminate CO2
- Pulmonary venous blood (the effluent) from areas with low V/Q ratios has low O2 tension and high CO2 tension—similar to systemic mixed venous blood.
- Blood from these units tends to depress arterial O2 tension and elevate arterial CO2
- The effect on arterial O2 tension is much more profound than on CO2 tension.
- Arterial CO2 tension often decreases due to a hypoxemia-induced reflex increase in alveolar ventilation.
- Compensatory Mechanisms:
- An appreciable compensatory increase in O2 uptake cannot take place in remaining areas where V/Q is normal because pulmonary end-capillary blood is usually already maximally saturated with O2
- COVID-19 Implications:
- COVID-19 is associated with increased ventilation-perfusion mismatch, resulting in reduced oxygenation.
- Alveolar and interstitial damage contribute to impaired ventilation of alveoli.
- Prothrombotic effects of COVID-19 contribute to the development of pulmonary emboli, reducing lung perfusion and increasing dead space ventilation.
- COVID-19 is associated with increased ventilation-perfusion mismatch, resulting in reduced oxygenation.
Shunts
- Definition:
- Shunting refers to the process where desaturated, mixed venous blood from the right heart returns to the left heart without being oxygenated in the lungs.
- The overall effect of shunting is to decrease (dilute) arterial O2
- Types of Shunts:
- Right-to-Left Shunt:
- This type of shunt decreases arterial O2 content and leads to hypoxemia.
- Left-to-Right Shunt:
- This type of shunt, in the absence of pulmonary congestion, does not produce hypoxemia.
- Right-to-Left Shunt:
Intrapulmonary Shunts
Intrapulmonary shunts are often classified as absolute or relative:
- Absolute Shunt: Refers to anatomic shunts and lung units where the ventilation/perfusion (V/Q) ratio is zero. In this case, blood passes through the lung without being oxygenated.
- Relative Shunt: An area of the lung with a low V/Q ratio. Some oxygenation occurs, but it is less efficient than normal.
Clinically, hypoxemia resulting from a relative shunt can usually be partially corrected by increasing the inspired O2 concentration. However, hypoxemia caused by an absolute shunt cannot be corrected by increasing the inspired O2 concentration.
Venous Admixture
- Venous Admixture: The amount of mixed venous blood that would have to be mixed with pulmonary end-capillary blood to account for the difference in O2 tension between arterial and pulmonary end-capillary blood.
- Pulmonary end-capillary blood is considered to have the same concentrations as alveolar gas.
- Venous admixture is usually expressed as a fraction of total cardiac output (Q̇).
- The equation for venous admixture (Qs/Qt) can be derived using the law for the conservation of mass for O2 across the pulmonary bed:
Qs/QT = (Cc’O2 – CaO2) / (Cc’O2 – CvO2)
Qs = blood flow through the physiologic shunt compartment
QT = total cardiac output
Qc’ = blood flow across normally ventilated pulmonary capillaries
QT = Qc’ + Qs
Cc’O2 = oxygen content of ideal pulmonary end-capillary blood
CaO2 = arterial oxygen content
CvO2 = mixed venous oxygen content
- Venous admixture can be calculated clinically by obtaining mixed venous and arterial blood gas measurements; the former requires a pulmonary artery catheter.
- The alveolar gas equation is used to derive pulmonary end-capillary O2 tension:
PAO2=FIO2×(PB−PH2O)−(PaCO2/R)
- PAO2 = alveolar oxygen tension
- FIO2 = fraction of inspired oxygen
- PB = barometric pressure
- PH2O = water vapor pressure (usually 47 mmHg at body temperature)
- PaCO2 = arterial carbon dioxide tension
- R = respiratory quotient (usually 0.8)
- Pulmonary capillary blood is usually assumed to be 100% saturated for an FIO2 of 0.21 or greater.
- The calculated venous admixture assumes that all shunting is intrapulmonary and due to absolute shunts. In reality, neither is ever the case; nonetheless, the concept is useful clinically.
- Normal venous admixture is primarily due to communication between deep bronchial veins and pulmonary veins, the thebesian circulation in the heart, and areas of low V/Q ratios in the lungs.
- The venous admixture in normal individuals (physiological shunt) is typically less than 5% of the cardiac output.
Summary
- Absolute Shunt: No ventilation, V/Q = 0. Hypoxemia not corrected by increasing FIO2.
- Relative Shunt: Low V/Q ratio. Hypoxemia partially corrected by increasing FIO2.
- Venous Admixture: The amount of mixed venous blood needed to explain the arterial O2 tension. Calculated using mixed venous and arterial blood gases and the alveolar gas equation. Assumes 100% saturation of pulmonary capillary blood and intrapulmonary shunting. Normal physiological shunt is less than 5%.
Alveolar, Arterial, and Venous Gas Tension
- Gas Mixtures and Partial Pressure: Each gas in a mixture contributes separately to total gas pressure, with its partial pressure proportional to its concentration. Air, with 21% O2, at a barometric pressure of 760 mm Hg, has an O2 partial pressure (PO2) of 159.6 mm Hg: 760 mm Hg × 0.21 = 159.6 mm Hg.
- General Equation for Partial Pressure:
- PIO2 = PB × FiO2
- PB = barometric pressure
- FiO2 = fraction of inspired O2
- PIO2 = PB × FiO2
Oxygen Alveolar Oxygen Tension
- Humidification and Water Vapor: Inspired gas is humidified at 37°C, reducing PIO2 by the water vapor pressure of 47 mm Hg at this temperature. The normal PO2 at sea level in humidified air is 150 mm Hg:
- (760–47) × 0.21 = 150 mm Hg
- General Equation for Alveolar O2 Tension:
- PIO2 = (PB–PH2O) × FiO2
- PH2O = vapor pressure of water at body temperature
- Estimation of Alveolar O2 Tension (PAO2):
- PAO2 = FIO2 × (PB – PH2O) – (PaCO2 / RQ)
- PaCO2 = arterial CO2 tension
- RQ = respiratory quotient, usually not measured
- PAO2 = FIO2 × (PB – PH2O) – (PaCO2 / RQ)
- Hypoxia and PaCO2: Large increases in PaCO2 (>75 mm Hg) can cause hypoxia (PaO2 <60 mm Hg) at room air but not at high inspired O2 concentrations.
Pulmonary End-Capillary Oxygen Tension
- PAO2 and Pc’O2 Gradient: For practical purposes, pulmonary end-capillary O2 tension (Pc’O2) is considered identical to PAO2; the gradient is normally minute.
- Factors Affecting Pc’O2: Rate of O2 diffusion across the alveolar-capillary membrane, pulmonary capillary blood volume, and transit time. The large surface area and thin membrane facilitate O2 diffusion. Enhanced O2 binding to hemoglobin at saturations above 80% augments O2 diffusion.
- Capillary Transit Time: Estimated by dividing pulmonary capillary blood volume by cardiac output; normal transit time is 70 mL ÷ 5000 mL/min (0.8 s). Maximum Pc’O2 is usually attained after 0.3 s, providing a large safety margin.
- O2 Transfer and Binding: O2 binding to hemoglobin is the principal rate-limiting factor in O2 transfer. Pulmonary diffusing capacity reflects alveolar-capillary membrane capacity, permeability, and pulmonary blood flow. O2 uptake is normally limited by pulmonary blood flow, not O2 diffusion, which may become significant during exercise at high altitudes and in patients with extensive membrane destruction.
- O2 Diffusing Capacity (DLO2): Pc’O2 cannot be accurately measured; carbon monoxide diffusion capacity (DLCO) is used to assess gas transfer, as carbon monoxide has a high affinity for hemoglobin, making Pc’CO effectively zero.
- Reductions in DLCO: Imply impediments in gas transfer, due to abnormal V/Q ratios, extensive membrane destruction, or short capillary transit times. Abnormalities are accentuated by increased O2 consumption and cardiac output during exercise.
Arterial Oxygen Tension
- Measurement of PaO2: Must be measured at room air, not calculated like PAO2. The alveolar-to-arterial O2 partial pressure gradient (A–a gradient) is normally less than 15 mm Hg but increases with age up to 20 to 30 mm Hg. Arterial O2 tension can be approximated by the following formula (in mm Hg):
- PaO2 = PIO2 – (PaCO2 / RQ)
- Age-Related Changes: Decreases in PaO2 are likely due to a progressive increase in closing capacity relative to functional residual capacity (FRC).
Hypoxemia
Mechanisms
Low Alveolar Oxygen Tension
- Contributing Factors:
- Low inspired oxygen tension (e.g., reduced oxygen concentration in the ambient air).
- Low fractional inspired oxygen concentration (FiO2).
- High altitude, leading to reduced atmospheric oxygen tension.
- Alveolar hypoventilation, causing inadequate oxygen delivery to alveoli.
- Diffusion hypoxia, often following high concentration nitrous oxide use.
- Increased oxygen consumption (e.g., during exercise, fever, or metabolic stress).
Increased Alveolar-Arterial (A–a) Gradient
- Key Contributors:
- Right-to-Left Shunting: Blood bypasses the oxygenation process in the lungs.
- Low V/Q Ratios: Regions of the lung receive inadequate ventilation relative to perfusion, leading to inefficient gas exchange.
Other Contributing Factors
- Low Mixed Venous Oxygen Tension (PvO2): Reflects the balance of oxygen delivery and consumption; a lower value exacerbates hypoxemia.
- Decreased Cardiac Output: Reduces oxygen delivery and contributes to an increased A–a gradient.
- Increased Oxygen Consumption: Increases demand, potentially leading to lower PvO2 and worsened hypoxemia.
- Decreased Hemoglobin Concentration: Reduces blood’s oxygen-carrying capacity, affecting overall oxygen delivery.
Key Points on Hypoxemia Mechanisms
1. Increased A–a Gradient
- Prevalence: Most common mechanism underlying hypoxemia.
- Shunt Dependence:
- A–a gradient increases with shunt magnitude.
- Inversely related to PvO2, as low PvO2 exacerbates shunting effects.
- FiO₂ Response:
- Larger shunts reduce the ability of higher FiO2 to correct hypoxemia.
- Iso-shunt lines (O₂ correction curves) are most accurate for FiO2 between 35% and 100%.
2. Cardiac Output and A–a Gradient
- Low Cardiac Output:
- Decreases PvO2, accentuating shunt effects on arterial oxygenation.
- May trigger pulmonary vasoconstriction, reducing venous admixture.
- High Cardiac Output:
- Increases PvO2, potentially inhibiting hypoxic pulmonary vasoconstriction.
- Can paradoxically increase venous admixture by maintaining low-perfusion areas.
3. O₂ Consumption and Hemoglobin Concentration
- High O₂ Consumption:
- Conditions like fever, shivering, or hypermetabolic states increase oxygen demand, lowering PvO2 and PaO₂.
- Low Hemoglobin Concentration:
- Reduces the blood’s oxygen-carrying capacity, indirectly increasing the A–a gradient and impairing oxygenation.
Mixed Venous Oxygen Tension (PvO2)
- Normal Values:
- PvO2 is typically ~40 mmHg, representing the equilibrium between oxygen delivery and consumption.
- Sampling requires pulmonary artery catheterization to ensure inclusion of venous return from the superior vena cava, inferior vena cava, and coronary sinus
Alterations in Mixed Venous Oxygen Tension
Decreased PvO2
- Increased Oxygen Consumption:
- Causes include fever, shivering, exercise, malignant hyperthermia, and thyroid storm.
- Decreased Oxygen Delivery:
- Hypoxia.
- Reduced cardiac output.
- Low hemoglobin concentration or abnormal hemoglobin types.
Increased PvO2
- Mechanisms:
- Left-to-right shunting increases oxygenated blood in venous circulation.
- High cardiac output raises PvO2 by reducing extraction ratios.
- Impaired tissue oxygen uptake (e.g., cyanide poisoning).
- Decreased Oxygen Consumption:
- Conditions like hypothermia or sepsis may reduce metabolic demand for oxygen.
- Sampling errors, such as improper catheter placement, can falsely elevate PvO2.
Carbon Dioxide
- Production: Carbon dioxide (CO2) is produced by aerobic metabolism in mitochondria.
- Gradients: There are gradients for CO2 tension from mitochondria to cell cytoplasm, extracellular fluid, venous blood, and alveoli, where CO2 is finally eliminated.
Mixed Venous Carbon Dioxide Tension
- Normal Values: Normal mixed venous CO2 tension is about 46 mm Hg.
- End Result: This value is the result of the mixing of blood from tissues with varying metabolic activities.
- Low Metabolic Activity: Venous CO2 tension is lower in tissues with low metabolic activity (e.g., skin).
- High Metabolic Activity: Venous CO2tension is higher in blood from tissues with relatively high activity (e.g., heart).
Alveolar Carbon Dioxide Tension
- PACO2: Alveolar CO2 tension (PACO2generally represents the balance between total CO2 production and alveolar ventilation (elimination).
- PAC02 = VC02/ VA
- where A is alveolar ventilation.
- During periods of acute hypoventilation or hypoperfusion, body content of carbon dioxide increases.
- Clinically, PACO2 is more dependent on variations in alveolar ventilation than in CO2 production, because
- CO2 production does not vary appreciably under most circumstances. However, conditions such as malignant hyperthermia can lead to dramatic increases in CO2 production, which can overwhelm the body’s buffering system
Pulmonary End-Capillary Carbon Dioxide Tension
- Pulmonary end-capillary CO2 tension (Pc′CO2) is virtually identical to PACO2 for the same reasons as those discussed in the section about O2.
- In addition, the diffusion rate for CO2 across the alveolar–capillary membrane is 20 times that of O2.
- Arterial Carbon Dioxide Tension Arterial CO2 tension (PaCO2), which is readily measurable, is identical to Pc′CO2, and, necessarily, PACO2. Normal PaCO2 is 38 ± 4 mm Hg (5.1 ± 0.5 kPa); in practice, 40 mm Hg is usually considered normal. Although low ratios tend to increase PaCO2, whereas high ratios tend to decrease it, significant arterial-to-alveolar gradients for CO2 develop only in the presence of marked abnormalities (>30% venous admixture); even then, the gradient is relatively small (2–3 mm Hg).
- Moreover, small increases in the gradient appreciably increase CO2 output into alveoli with relatively normal. Even moderate to severe disturbances usually fail to appreciably alter arterial CO2 because of a reflex increase in ventilation from concomitant hypoxemia.
- End-Tidal Carbon Dioxide Tension Because end-tidal gas is primarily alveolar gas and PACO2 is virtually identical to PaCO2, end-tidal CO2 tension (PETCO2) is used clinically as an estimate of PaCO2. T
- The PACO2–PETCO2 gradient is normally less than 5 mm Hg and represents the dilution of alveolar gas with CO2-free gas from nonperfused alveoli (alveolar dead space).
Transport of Respiratory Gases in Blood
Oxygen (O₂) is transported in the blood in two forms: dissolved in plasma and bound to hemoglobin.
Dissolved Oxygen
-
Mechanism: The amount of O₂ dissolved in blood is described by Henry’s law:
Gas Concentration=α×Partial Pressure
where α is the solubility coefficient for a given gas at a specific temperature. -
Solubility Coefficient:
- For O₂ at normal body temperature, α 0.003 mL/dL/mmHg.
- Example: At a PaO₂ of 100 mmHg, dissolved O₂ is only 0.3 mL/dL, which is negligible compared to hemoglobin-bound O₂.
Hemoglobin
-
Structure:
- Hemoglobin consists of four heme groups and four protein subunits.
- Heme Group: An iron-porphyrin complex; only the ferrous form (Fe²⁺) can bind O₂.
- Subunits: Normal hemoglobin (HbA1) has two α and two β chains.
-
Oxygen-Carrying Capacity:
- Each gram of hemoglobin can carry up to 1.39 mL of O₂.
Hemoglobin Dissociation Curve

- Shape: The curve has an S-shape due to cooperative binding between hemoglobin subunits.
- Oxygen Binding:
- The binding of the first three O₂ molecules accelerates the attachment of the fourth.
- At ~90% saturation, the curve flattens as available binding sites decrease.
Factors Influencing the Hemoglobin Dissociation Curve
The hemoglobin dissociation curve reflects the relationship between oxygen partial pressure (PaO₂) and hemoglobin saturation. Shifts in the curve indicate changes in O₂ binding affinity.
Rightward Shift (Decreased Affinity for O₂, Facilitating Release)
- Increased Hydrogen Ion Concentration (Bohr Effect):
- Lower pH increases H⁺ concentration, promoting O₂ release.
- This effect is more pronounced in venous blood, enhancing tissue oxygenation.
- Elevated CO₂ Levels:
- High PaCO₂ increases H⁺ concentration, reducing O₂ affinity.
- This occurs in venous blood to enhance O₂ unloading.
- Increased Temperature:
- High temperatures decrease O₂ affinity, aiding tissue delivery.
- Elevated 2,3-Diphosphoglycerate (2,3-DPG):
- Binds to deoxygenated hemoglobin, stabilizing it and promoting O₂ release, especially during chronic anemia or hypoxemia.
Leftward Shift (Increased Affinity for O₂, Reducing Release)
- Decreased CO₂ Levels and Increased pH:
- Occur in pulmonary capillaries, enhancing O₂ uptake.
- Lower Temperature:
- Decreases O₂ release to tissues.
- Reduced 2,3-DPG Levels:
- Decreases tissue oxygenation, commonly seen in stored blood.
Abnormal Ligands
Certain ligands interfere with O₂ binding or transport:
- Carbon Monoxide (CO):
- Affinity for hemoglobin is 200–300× higher than O₂, forming carboxyhemoglobin.
- Reduces O₂ delivery by blocking binding sites and impairing release.
- Cyanide (CN⁻) and Hydrogen Sulfide (H₂S):
- Bind to O₂ sites, reducing hemoglobin’s capacity to carry oxygen.
- Nitric Oxide (NO):
- Hemoglobin may transport NO to modulate tissue oxygen delivery.
- Carbon Dioxide (CO₂):
- Binds allosterically to hemoglobin, favoring O₂ unloading at tissues.
Abnormal Forms of Hemoglobin
- Methemoglobin:
- Mechanism: Iron is oxidized to ferric form (Fe³⁺), which cannot bind O₂.
- Effects: Reduces O₂ delivery by impairing binding and shifting the curve leftward.
- Causes: Nitrates, nitrites, sulfonamides, and certain drugs.
- Treatment: Methylene blue or ascorbic acid restores normal hemoglobin.
- Fetal Hemoglobin (HbF):
- Higher O₂ affinity than adult hemoglobin, aiding maternal-fetal O₂ transfer.
- Sickle Hemoglobin (HbS):
- Deforms red cells under hypoxic conditions, reducing O₂ delivery and causing complications.
- Hemoglobin A2 (HbA2):
- A minor adult hemoglobin variant, comprising 2–3% of total hemoglobin.
Oxygen Content
- The total oxygen (O2) content of blood is the sum of that dissolved in plasma plus that carried by hemoglobin. In reality, O2 binding to hemoglobin never achieves the theoretical maximum, but it is close to 1.31 mL O2/dL blood per millimeter of mercury. Total O2 content is expressed by the following equation:
O2 content = (0.003 x PO2) + (SO2 x Hb x 1.31 mL/dL blood) - PO2: Partial pressure of oxygen
- SO2: Oxygen saturation
- Hb: Hemoglobin concentration
where Hb is hemoglobin concentration in g/dL blood, and SO2 is hemoglobin saturation at the given PO2. Using this formula and a hemoglobin of 15 g/dL, the normal O2 content for both arterial and mixed venous blood and the arteriovenous difference can be calculated as follows:
Oxygen Transport
- O2 transport is dependent on both respiratory and circulatory function. Total O2 delivery to tissues is the product of arterial O2 content and cardiac output:
- CaO2 = (0.003 x 100) + (0.975 x 15 x 1.31) = 19.5 mL/dL blood
- CvO2 = (0.003 x 40) + (0.75 x 15 x 1.31) = 14.8 mL/dL blood
- CaO2 – CvO2 = 4.7 mL/dL blood
- Note that arterial O2 content is dependent on PaO2 as well as hemoglobin concentration. As a result, deficiencies in O2 delivery may be due to a low PaO2, a low hemoglobin concentration, or an inadequate cardiac output. Normal O2 delivery can be calculated as follows:
- DO2 = CaO2 x QT
- The Fick equation expresses the relationship between O2 consumption, O2 content, and cardiac output:
- O2 delivery = 20 mL O2/dL blood x 50 dL blood/min = 1000 mL O2/min
- O2 consumption = VO2 = QT x (CaO2 – CvO2)
- Rearranging the equation:
- CaO2 = VO2/QT + CvO2
- Consequently, the arteriovenous difference is a good measure of the overall adequacy of O2 delivery. As calculated above, the arteriovenous difference is about 5 mL O2/dL blood (20 mL O2/dL–15 mL O2/dL). Note that the normal extraction fraction is 5 mL ÷ 20 mL, or 25%; thus, the body normally consumes only 25% of the O2 carried on hemoglobin.
- When O2 demand exceeds supply, the extraction fraction exceeds 25%. Conversely, if O2 supply exceeds demand, the extraction fraction falls below 25%. When O2 delivery is even moderately reduced, VO2 usually remains normal because of increased O2 extraction (mixed venous O2 saturation decreases); VO2 remains independent of delivery. With further reductions in DO2, however, a critical point is reached beyond which VO2 becomes directly proportional to DO2. This state of supply-dependent O2 is typically associated with progressive lactic acidosis caused by cellular hypoxia.
Oxygen Stores
- The concept of O2 stores is important in anesthesia. When the normal flux of O2 is interrupted by apnea, existing O2 stores are consumed by cellular metabolism; if stores are depleted, hypoxia and eventual cell death follow.
- Theoretically, adults normally store about 1500 mL of O2. This includes the O2 remaining in the lungs, that bound to hemoglobin (and myoglobin), and that dissolved in body fluids. Unfortunately, the high affinity of hemoglobin for O2 (the affinity of myoglobin is even higher), and the very limited quantity of O2 in solution, restrict the availability of these stores.
- The O2 contained within the lungs at functional residual capacity (FRC), therefore, becomes the most important source of O2. Apnea in a patient previously breathing room air leaves approximately 480 mL of O2 in the lungs (if FiO2 = 0.21 and FRC = 2300 mL, O2 content = FiO2 × FRC). The metabolic activity of tissues rapidly depletes this reservoir (presumably at a rate equivalent to VO2); severe hypoxemia usually occurs within 90 seconds. The onset of hypoxemia can be delayed by increasing the FiO2 prior to the apnea.
- Following ventilation with 100% O2, FRC contains about 2300 mL of O2; this delays hypoxemia following apnea for 4 to 5 minutes. This concept is the basis for preoxygenation (denitrogenation) prior to induction of anesthesia.
Carbon Dioxide
Carbon dioxide (CO₂) is transported in the blood in three forms: dissolved in solution, as bicarbonate, and with proteins as carbamino compounds. The sum of all three forms constitutes the total CO₂ content of blood, which is routinely reported with electrolyte measurements.
- Reaction:
- H2O + CO2 ↔ H2CO3 ↔ H+ + HCO3-
Plasma CO₂ Reaction and Role of Carbonic Anhydrase
- Less than 1% of dissolved CO₂ in plasma undergoes the above reaction. The enzyme carbonic anhydrase, present in erythrocytes and endothelium, significantly accelerates this reaction. Consequently, bicarbonate forms the largest fraction of CO₂ in blood.
- Effect of Acetazolamide: Administration of acetazolamide, a carbonic anhydrase inhibitor, can impair CO₂ transport between tissues and alveoli.
- Chloride (Hamburger) Shift: On the venous side of systemic capillaries, CO₂ enters red blood cells and converts to bicarbonate, which diffuses into plasma; chloride ions move into red cells to maintain electrical balance. In pulmonary capillaries, the reverse occurs: chloride ions exit red cells as bicarbonate re-enters, converting back to CO₂ and diffusing into alveoli.
Carbamino Compounds
- CO₂ reacts with amino groups on proteins:
- R-NH2 + CO2 → RNH-CO2- + H+
- At physiological pH, a small amount of CO₂ is carried in this form, mainly as carbaminohaemoglobin. Deoxygenated hemoglobin (deoxyhemoglobin) has a 3.5 times greater affinity for CO₂ than oxyhemoglobin, resulting in venous blood carrying more CO₂ than arterial blood (Haldane effect).
- PCO₂ normally has little effect on the fraction of CO₂ carried as carbaminohaemoglobin.

Effects of Hemoglobin Buffering on Carbon Dioxide Transport
- Hemoglobin as a Buffer: Hemoglobin can act as a buffer at physiological pH due to its high histidine content. Its acid-base behavior is influenced by its oxygenation state.
- Oxygenation and CO₂ Transport:
- In tissue capillaries, removal of O₂ from hemoglobin causes it to behave more like a base, taking up hydrogen ions and shifting the CO₂–bicarbonate equilibrium toward greater bicarbonate formation:
- H+ + HbO2 → HbH+ + O2
- Deoxyhemoglobin increases the amount of CO₂ carried:
- CO2 + H2O + HbO2 → HbH+ + HCO3- + O2
- In venous blood, CO₂ is primarily transported as bicarbonate. As CO₂ is taken up from tissues and converted to bicarbonate, the total CO₂ content of blood increases. The reverse process occurs in the lungs, where oxygenation of hemoglobin favors its action as an acid, releasing hydrogen ions and shifting the equilibrium toward greater CO₂ formation:
- O2 + HCO3- + HbH+ → H2O + CO2 + HbO2
- In tissue capillaries, removal of O₂ from hemoglobin causes it to behave more like a base, taking up hydrogen ions and shifting the CO₂–bicarbonate equilibrium toward greater bicarbonate formation:
Carbon Dioxide Content of Plasma (mmol/L)
| Component | Arterial | Venous |
|---|---|---|
| Dissolved CO₂ | 1.2 | 1.4 |
| Bicarbonate | 24.4 | 26.2 |
| Carbamino CO₂ | Negligible | Negligible |
| Total CO₂ | 25.6 | 27.6 |
Carbon Dioxide Dissociation Curve
A CO₂ dissociation curve can be constructed by plotting the total CO₂ content of blood against PCO₂. The contribution of each form of CO₂ can also be quantified in this manner.
Carbon Dioxide Stores
- Storage Capacity: The body has large CO₂ stores, approximately 120 L in adults, primarily in the form of dissolved CO₂ and bicarbonate.
- Equilibrium: Establishing a new CO₂ equilibrium requires 20 to 30 minutes in case of imbalance between production and elimination, compared to less than 4 to 5 minutes for O₂.
- Compartments: CO₂ is stored in rapid-, intermediate-, and slow-equilibrating compartments. Due to the larger capacity of the intermediate and slow compartments, the rate of rise in arterial CO₂ tension is generally slower than its fall following acute changes in ventilation.
Control of Breathing
Spontaneous ventilation arises from rhythmic neural activity in the respiratory centers of the brainstem, coordinating respiratory muscle function to maintain normal O₂ and CO₂ levels. This activity is modulated by volitional and autonomic inputs, as well as signals from central and peripheral sensors.
Central Respiratory Centers
- Medullary Groups:
- Dorsal Respiratory Group (DRG): Primarily active during inspiration.
- Ventral Respiratory Group (VRG): Active during both inspiration and expiration.
- Pontine Areas:
- Lower Pontine (Apneustic) Center: Provides excitatory signals to sustain inspiration.
- Upper Pontine (Pneumotaxic) Center: Inhibitory role in regulating inspiratory duration and overall rhythm.
Central Sensors
- Location: Central chemoreceptors are located on the anterolateral surface of the medulla.
- Mechanism of Action:
- The blood-brain barrier permits CO₂ diffusion but restricts bicarbonate ions.
- Increases in PaCO₂ raise H⁺ concentration in cerebrospinal fluid (CSF), stimulating chemoreceptors and adjacent respiratory centers to enhance ventilation, lowering PaCO₂.
- Decreases in CSF H⁺ reduce ventilation, allowing PaCO₂ to rise.
- The PaCO₂-ventilation relationship is linear but attenuated at very high PaCO₂ levels (CO₂ narcosis).
- Apneic Threshold:
- The PaCO₂ below which ventilation ceases.
- Under anesthesia, spontaneous breathing typically halts below this threshold.
- Hypoxia Effects:
- Central chemoreceptor activity is suppressed by hypoxia, in contrast to peripheral chemoreceptors.
Peripheral Sensors
- Primary Locations:
- Carotid Bodies: Located at the bifurcation of the common carotid arteries, these are the principal peripheral chemoreceptors in humans.
- Aortic Bodies: Situated near the aortic arch.
- Carotid Body Functions:
- Sensitive to changes in PaO₂, PaCO₂, pH, and arterial pressure.
- Respond strongly to reductions in PaO₂ (below 50 mmHg), with signals transmitted to respiratory centers via glossopharyngeal nerves.
- Stimulated by agents like cyanide, doxapram, and large nicotine doses.
- Dopaminergic glomus cells mediate their activity.
Lung Receptors
- Stretch Receptors:
- Located in airway smooth muscle; regulate inspiration duration (Hering–Breuer reflex).
- Rarely significant in humans; bilateral vagal nerve blocks have little effect on respiratory patterns.
- Irritant Receptors:
- Found in tracheobronchial mucosa, activated by noxious stimuli, triggering bronchoconstriction, coughing, and tachypnea.
- Juxtacapillary (J) Receptors:
- Found in alveolar walls; respond to increased interstitial volume or chemical mediators, causing dyspnea.
Other Receptors
- Found in chest wall and pulmonary muscles, likely contributing to respiratory adaptation during exercise or pathological conditions affecting compliance.
Effects of Anesthesia on Breathing Control
- General Effects:
- Anesthetics depress chemoreceptor activity and intercostal muscle function, promoting hypoventilation proportional to anesthetic depth.
- The ventilatory response to CO₂ diminishes (reduced slope of the PaCO₂/minute ventilation curve), and the apneic threshold increases.
- Specific Effects:
- Peripheral hypoxic response is more sensitive to anesthetics than central CO₂ response, often abolished at subanesthetic doses.
- Surgical stimulation can partially counteract these effects.
Summary of Anaesthetic Impact
- Muscle Tone Reduction:
- Decreased thoracic diameter and lung volumes.
- Increased work of breathing and risk of atelectasis.
- Blunted Chemoreceptor Response:
- Reduced ventilatory response to hypoxia and hypercarbia.
- Other Biological Effects:
- Decreased surfactant production and alveolar macrophage activity.
- Tracheal cuff interference with mucus flow.
- Increased airway resistance due to reduced humidity and viscous secretions.
Non-Respiratory Functions of the Lung
Filtration
- Pulmonary capillaries filter bloodstream debris due to their in-series circulatory position.
- Fibrin debris is broken down by high levels of heparin and plasminogen activator in the lung.
- Despite a mean capillary diameter of 7 μm, larger particles like fat macroglobules can pass through to systemic circulation.
Reservoir Function
- The pulmonary circulation serves as a blood reservoir, adjusting blood volume during systemic hemodynamic changes.
Metabolic Activity
- Surfactant Synthesis: Critical for maintaining alveolar stability.
- Detoxification: Extrahepatic mixed-function oxidation occurs in lung tissue.
- Immune Response: Neutrophils and macrophages generate reactive oxygen species to combat infections.
Vasoactive Metabolites
- Inactivation:
- Norepinephrine, serotonin, bradykinin, and prostaglandins are metabolized by pulmonary endothelium.
- Histamine and epinephrine are not metabolized but may be synthesized and released in allergic reactions.
- Angiotensin Conversion:
- Pulmonary endothelium converts angiotensin I to angiotensin II via angiotensin-converting enzyme (ACE), regulating systemic vascular tone and fluid balance.
Links
- Hypoxia Pulmonary Vasoconstriction (HPV)
- General ICU
- Ventilation and Weaning
- Off Pump CABG
- Tuberculosis (TB)
- Bronchiectasis
- Asthma and Chronic Obstructive Pulmonary Disease (COPD)
- One lung Ventilation and VATS
References:
- Chambers D, Huang CLH, Matthews G. Basic physiology for anaesthetists. Cambridge, United Kingdom: Cambridge University Press; 2015.
- The Calgary Guide to Understanding Disease. (2024). Retrieved June 5, 2024, from https://calgaryguide.ucalgary.ca/
- FRCA Mind Maps. (2024). Retrieved June 5, 2024, from https://www.frcamindmaps.org/
- Anesthesia Considerations. (2024). Retrieved June 5, 2024, from https://www.anesthesiaconsiderations.com/
- ICU One Pager. (2024). Retrieved June 5, 2024, from https://onepagericu.com/
- Allman K, Wilson I, O’Donnell A. Oxford Handbook of Anaesthesia. Vol. 4. Great Clarendon Street, Oxford, OX2 6DP, United Kingdom: Oxford University Press; 2016.
- Butterworth J, Mackey D, Wasnick J. Morgan and Mikhail’s Clinical Anesthesiology, 7th Edition. 7th edition. New York: McGraw Hill Medical; 2022.
Summaries:
Respiratory
Thoracic Anaesthesia
Resp physiology 01
Resp physiology 02
AGE and oxygen cascade
Calgary- Hypoxemia
Copyright
© 2025 Francois Uys. All Rights Reserved.
id: “d65e89a0-ce58-4002-bce4-3e00ddb9a08d”