{}
Basic Physiology
Cardiac Function
- Right Side: Primarily functions to manage blood flow.
- Left Side: Primarily responsible for generating pressure to drive systemic circulation.
- Endocrine Function:
- Regulation of Plasma Volume: Stretch receptors in the atria and ventricles detect increased plasma volume and trigger the release of atrial natriuretic peptide (ANP) and brain natriuretic peptide (BNP).
- Renal Effects: ANP and BNP promote diuresis by acting on the kidneys, reducing plasma volume.
Anatomy
- Heart Layers:
- Epicardium: The outermost layer of the heart.
- Pericardial Fluid: Resides between the epicardium and pericardium, providing lubrication.
- Pericardium: Encloses the heart and pericardial fluid.
- Myocardium: The middle layer, consisting of cardiac muscle:
- Contains striated muscle cells interconnected by intercalated discs.
- Endocardium: The innermost layer:
- Composed of epithelial cells in direct contact with blood.
- Continuous with the endothelium of the blood vessels.
Functional Syncytium
- Coupling in Cardiac Muscle:
- Cardiac muscle cells are interconnected electrically, chemically, and mechanically, enabling coordinated contraction.
Coronary Circulation
Overview
- Diffusion Limitation: The ventricular wall is too thick to allow effective diffusion of oxygen beyond the endocardium, necessitating coronary circulation.
- Coronary Arteries: Classified as end arteries, meaning they are the sole source of blood supply to the myocardium.
Sinuses of Valsalva and Eddy Currents
-
Anatomy:
- The aortic root contains three dilatations just above the aortic valve, known as the aortic sinuses or sinuses of Valsalva.
- These structures generate eddy currents that keep the valve cusps away from the aortic walls, ensuring smooth valve closure.
-
Coronary Artery Origins:
- The left coronary artery originates from the left posterior sinus.
- The right coronary artery arises from the anterior coronary sinus.
- Eddy currents prevent occlusion of these arteries, facilitating uninterrupted coronary blood flow.
Coronary Arteries
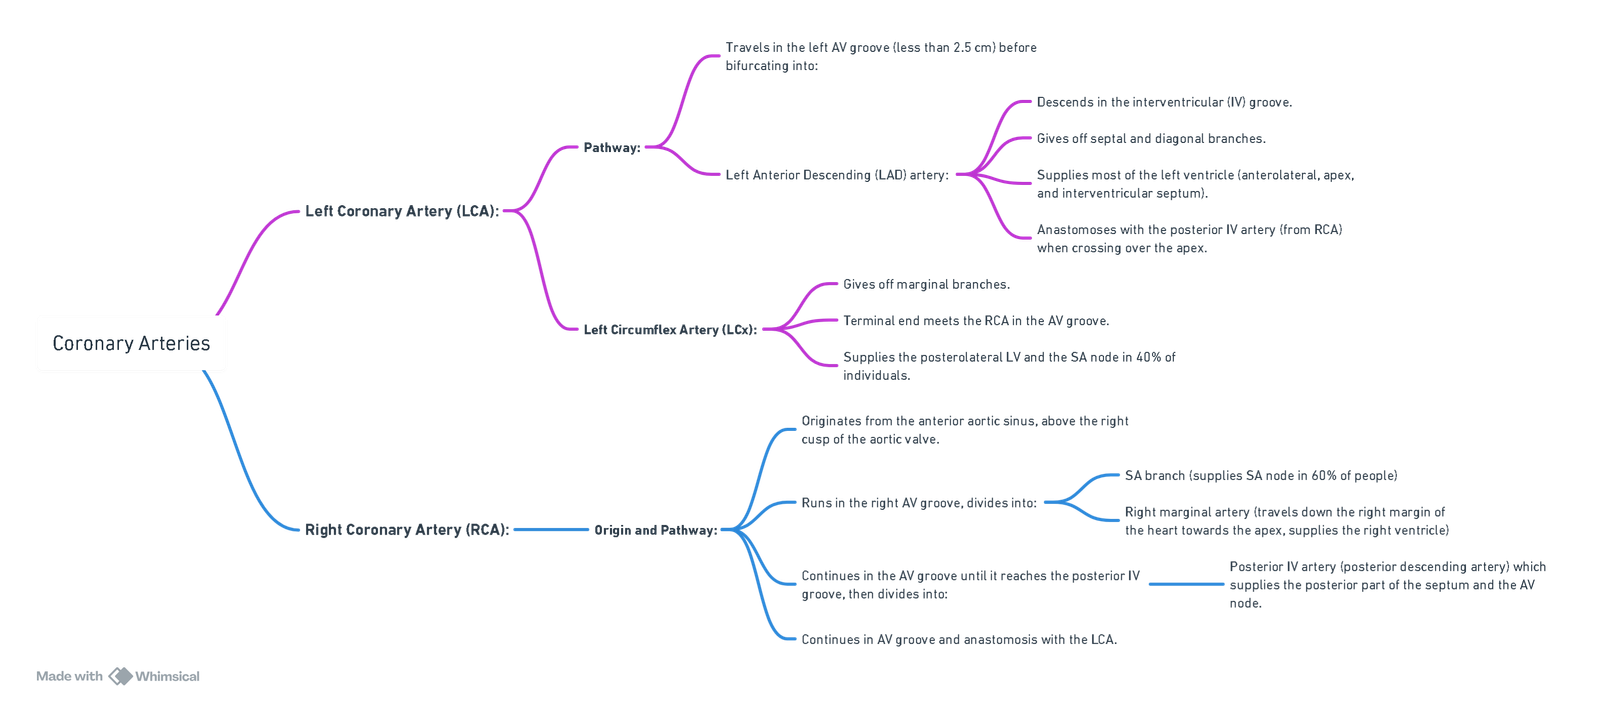
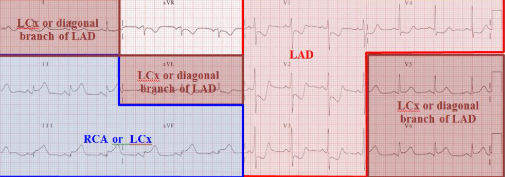
ECG Correlation
Variants
- Left Dominance (15%):
- The posterior interventricular artery arises from the left circumflex artery rather than the right coronary artery.
Coronary Veins
- Coronary Sinus (85%):
- Collects venous blood from the cardiac veins, which converge to form the coronary sinus.
- The coronary sinus opens into the right atrium between the inferior vena cava and the tricuspid valve.
- Thebesian Veins:
- The smallest cardiac veins, directly draining into all four heart chambers.
- Predominantly located in the right atrium and right ventricle.
- Contribute to a physiological shunt by allowing deoxygenated blood to enter the left ventricle.
Supply and Demand
- Resting Blood Flow:
- The heart receives ~250 mL/min of blood at rest, approximately 5% of cardiac output.
- Blood flow can increase up to fivefold during exercise.
- Oxygen Extraction:
- At rest, the heart extracts ~70% of the oxygen delivered to it, significantly higher than other organs (e.g., skeletal muscle at 25%).
- The combination of high oxygen demand and efficient extraction makes the heart particularly vulnerable to ischemia.
- Left Ventricle (LV):
- Coronary blood flow is intermittent due to high pressures during systole.
- Coronary arteries penetrate the myocardium at right angles and are compressed during systole, with most blood flow occurring during diastole.
- Right Ventricle (RV):
- Blood flow is continuous throughout the cardiac cycle due to lower pressures generated during right ventricular contraction.
Factors Affecting Coronary Blood Flow
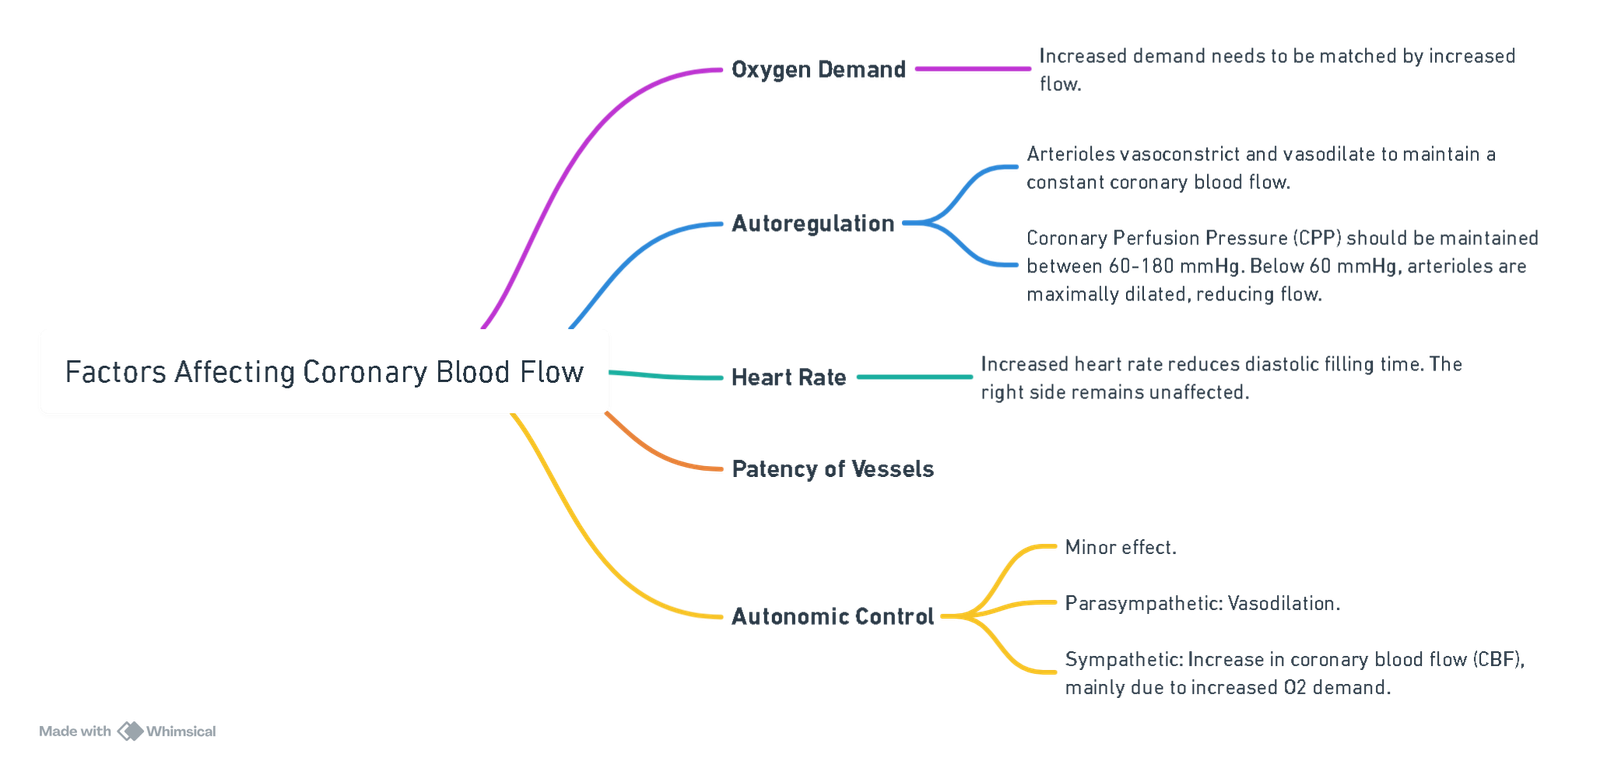
View or edit this diagram in Whimsical.
Cardiac Output
- Definition: The volume of blood ejected by the left or right ventricle per minute.
- Formula: CO=Stroke Volume (SV)×Heart Rate
- Normal Values:
- Cardiac Output: ~5.25 L/min at rest, increasing up to fourfold during stress.
- Cardiac Index (CI): 3–3.5 L/(min·m²).
Stroke Volume (SV)
- Definition: Volume of blood ejected by the left ventricle per heartbeat.
- Formula: SV=LVEDV−LVESV, where:
- LVEDV = Left Ventricular End-Diastolic Volume.
- LVESV = Left Ventricular End-Systolic Volume.
- Normal Values:
- Stroke Volume: 55–100 mL.
- Stroke Volume Index (SVI): 33–47 mL/(m²·beat).
Ejection Fraction (EF)
- Definition: The proportion of blood ejected from the left ventricle per heartbeat.
- Normal EF: 55–70%.
Heart Rate (HR)
-
Control: Set by the sinoatrial (SA) node, modulated by the autonomic nervous system (ANS).
- Resting HR:
- A denervated heart has a basal HR of 100–120 bpm.
- Vagal activity reduces HR to 60–70 bpm via acetylcholine (ACh) acting on muscarinic M2 receptors.
- During Exercise: Parasympathetic tone is withdrawn, and sympathetic stimulation increases HR through noradrenaline (NA) release.
- Resting HR:
-
Key Values:
- A single cardiac cycle at rest lasts 0.8 seconds (systole: 0.3 s, diastole: 0.5 s).
- CO increases up to ~140 bpm; beyond 150 bpm, reduced diastolic time (~0.15 s) decreases SV and CO.
- HR below 40 bpm reduces CO despite an increased SV.
- Optimal HR Range: 50–150 bpm.
- Maximum HR: HRmax=208−(0.7×age)
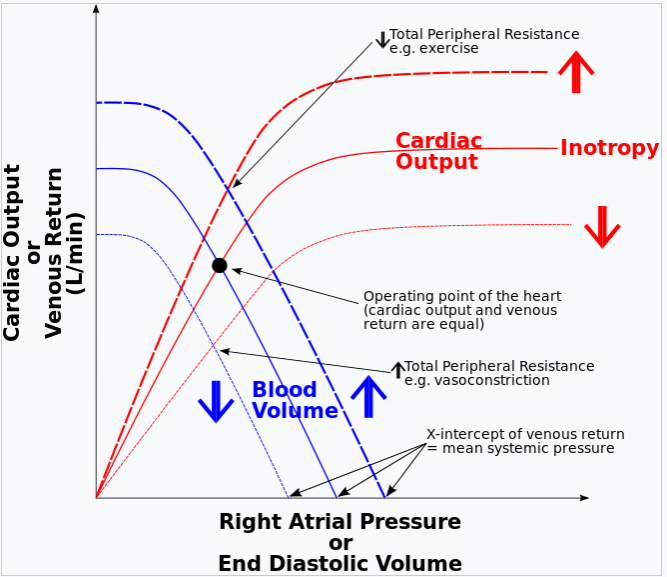
Preload
- Definition: The intraluminal pressure stretching the ventricle at its end-diastolic dimensions, determined mainly by venous return.
Starling’s Law
- Mechanism: The force of myocardial contraction depends on ventricular muscle fibre length at end-diastole:
- Increased preload enhances SV due to optimal actin-myosin overlap.
- Matching RV and LV Preload: Increased venous return to the RV increases its SV, which raises pulmonary blood flow, LVEDV, and subsequently LV SV.
Length-Tension Relationship
- Excessive Stretch: Overstretching reduces actin-myosin crossbridge formation, impairing contraction (e.g., ventricular failure).
Length-Independent Mechanism
- Ca²⁺ Sensitivity: Increased preload stretches sarcomeres, enhancing troponin C sensitivity to Ca²⁺ and improving contractility.
Contractility
- Definition: The intrinsic ability of cardiac myocytes to generate mechanical power independent of preload and afterload.
Afterload
- Definition: The stress developed in the left ventricular wall during ejection, reflecting forces opposing myocardial shortening.
- Effects: Increased afterload reduces sarcomere shortening, decreasing SV.
Compensation for Increased Afterload
- Starling Mechanism: Increased ESV raises LVEDV, enhancing subsequent SV.
- Anrep Effect: Intrinsic augmentation of inotropy in response to elevated afterload.
Measurement of Cardiac Output
Invasive Methods
- Techniques: Pulmonary artery catheter (PAC), central line, or arterial line.
Minimally Invasive Methods
- Technique: Oesophageal Doppler.
Non-Invasive Methods
- Techniques: Transthoracic echocardiography (TTE) and bioimpedance.
Fick’s Principle
Applied to Blood Flow to an Organ
- Blood flow to an organ = (Rate of uptake or excretion of substance) / (Arterio-venous concentration difference) or Q = M / (A – V).
- Q: Blood flow to the organ per minute.
- M: Number of moles of substance added or removed per minute.
- A: Arterial concentration of the substance.
- V: Venous concentration of the substance.
Applied to O₂
- CO (L/min) = VO₂ / {(CaO₂) – (CvO₂)}
- CO: Cardiac output.
- VO₂: Rate of O₂ uptake.
- CaO₂: Arterial O₂ content.
- CvO₂: Mixed venous O₂ content.
Dye Dilution Method
- Indicator dye (Indocyanine green – short half-life) is injected into PAC, and its concentration is continuously sampled at a peripheral arterial line (lithium can also be used).
- Recirculation causes a second peak; logarithmic transformation is used to analyze the area under the curve (AUC).
Stewart-Hamilton Equation
- CO = (amount of indicator) / (area under concentration-time graph).
Thermodilution
- Gold standard, no recirculation peak.
- Inflating the balloon at the tip of the PAC allows it to be ‘floated’ through the right atrium and right ventricle to the pulmonary artery.
- 10-15 mL of cold saline is injected through the most proximal lumen of the PAC (located in the right atrium).
- The change in pulmonary arterial blood temperature is measured by the thermistor, resulting in a temperature-time graph.
Modified Steward Hamilton
CO= {V(Tb-Ti) x 60} / tf(Tt-Tb)dt
Where:
- CO is the cardiac output (liters per minute).
- V is the volume of injectate (ml).
- T_b is the baseline blood temperature (°C).
- T_i is the temperature of the injectate (°C).
- T_t is the temperature of blood over time after injection (°C).
- t_0 is the time at the beginning of the measurement.
- t_f is the time at the end of the measurement.
Notes:
- The integral in the denominator represents the area under the thermodilution curve, i.e., the temperature difference (compared to baseline) over time.
- The factor 60 converts seconds to minutes (since the integral is over time in seconds).
- This is inversely related to the area under the curve—a larger area suggests slower dilution, hence lower CO, and vice versa.
- Units must be handled carefully to ensure CO results in L/min.
Pulse Contour Analysis
The morphology of the arterial pressure waveform is related to stroke volume (SV) and systemic vascular resistance (SVR). A continuous estimate of cardiac output (CO) is produced through a computer-based algorithm.
Calibrated Methods: PiCCO and LiDCO
General: Recalibration should be performed every 8 hours or whenever major hemodynamic changes occur.
PiCCO
- Setup: Involves central venous pressure (CVP) and a thermistor-tipped arterial line, typically sited at the femoral, brachial, or axillary artery.
- Mechanism: CO is estimated by analyzing the arterial pressure waveform, calibrated using the transpulmonary thermodilution method. Cold saline is injected into the central line, and the resulting blood temperature change is detected at the arterial line.
- Considerations: This method introduces an element of error compared to the thermodilution method using a pulmonary artery catheter (PAC), as heat dissipates while the cold injectate passes through the lungs.
LiDCO (Lithium Dilution Cardiac Output)
- Setup: Requires only a standard arterial line.
- Mechanism: Calibrated by the lithium dilution method, where lithium chloride is injected into a peripheral or central vein. The fall in arterial concentration of lithium is measured by a lithium electrode sampling the arterial line.
- Advantages: Avoids errors introduced by heat dissipation.
- Considerations: Cannot be used in patients on therapeutic lithium. Frequent calibration results in inaccuracies. Muscle relaxants may cross-react with the lithium electrode.
Non-calibrated Methods: FloTrac/Vigileo and LiDCOrapid
FloTrac/Vigileo
- Setup: A specialized pressure sensor (FloTrac) is attached to a standard arterial line. The pressure transducer is connected to a Vigileo monitor, which analyses the arterial pressure waveform.
- Mechanism: It is not externally calibrated; instead, it estimates aortic vascular compliance based on population demographics and the patient’s age, height, gender, and weight.
- Correlation: Shows good correlation with PAC thermodilution methods.
- Limitations: Not suitable for use in conditions with over or under-damped arterial line traces, cardiac arrhythmias, aortic regurgitation, or the presence of an intra-aortic balloon pump.
Oesophageal Doppler (CardioQ)
V= (c x Delta f)/ (2 x f0 x cos)
Doppler Equation
- v is the blood flow velocity.
- c is the speed of sound in blood (approximately 1540 m/s).
- Delta f is the Doppler frequency shift.
- f_0 is the transmitted frequency of the ultrasound.
- cos is the angle between the ultrasound beam and the direction of blood flow.
Mean Arterial Pressure (MAP)
- Formula:
- MAP ≈ CO × SVR, where:
- CO = Cardiac Output.
- SVR = Systemic Vascular Resistance.
- Derived from Darcy’s law: Pressure=Flow×Resistance
- MAP ≈ CO × SVR, where:
- Factors Influencing MAP:
- Increased by vasoconstriction and higher blood viscosity.
- Decreased by vasodilation and lower blood viscosity.
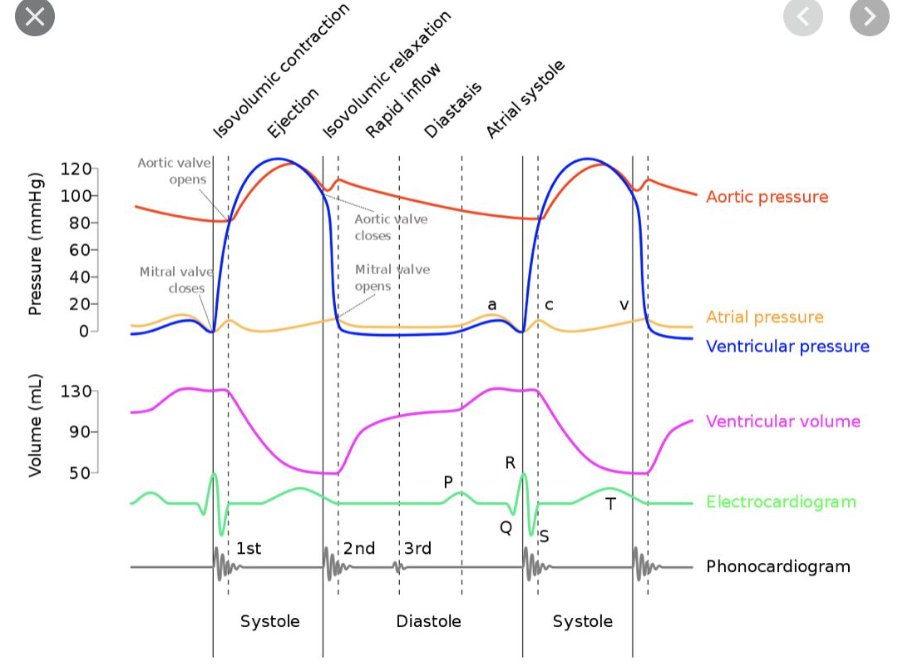
Cardiac Cycle Phases
Diastole (4 Stages)
- Isovolumetric Relaxation:
- The ventricles relax without a change in volume as semilunar valves close.
- Rapid Ventricular Filling:
- Blood rapidly flows from the atria to the ventricles due to a pressure gradient.
- Slow Ventricular Filling:
- Continued passive filling of the ventricles as atrial pressure remains slightly higher than ventricular pressure.
- Atrial Contraction:
- Atrial systole provides additional blood to the ventricles, especially during exercise.
Systole (2 Stages)
- Isovolumetric Contraction:
- Ventricular pressure rises sharply, closing the AV valves and producing the first heart sound (S1).
- Ventricular pressure increases without a volume change.
- Ejection:
- Semilunar valves open, and blood is ejected into the aorta and pulmonary artery.
Detailed Phases of the Cardiac Cycle
1. Slow Ventricular Filling
- Pressure Dynamics: Atrial pressure > ventricular pressure.
- Valve Status: AV valves open.
- Blood Flow: Passive, slow flow from atria to ventricles; accounts for ~90% of ventricular filling at rest.
2. Atrial Contraction
- Filling Contribution:
- ~10% of ventricular filling at rest.
- Up to 40% during exercise.
- CVP Waveform:
- A-wave represents atrial contraction pressure, transmitted along venae cavae and pulmonary veins.
- End-Diastolic Volume (EDV): Volume of blood in the ventricles at the end of diastole.
3. Isovolumetric Contraction
- Pressure Dynamics:
- Rapid increase in intraventricular pressure.
- Valve Dynamics:
- AV valves close as ventricular pressure exceeds atrial pressure, producing S1.
- Mitral valve closes slightly before the tricuspid valve, causing physiological S1 splitting.
- CVP Waveform:
- C-wave reflects tricuspid valve bulging into the right atrium.
- Key Feature:
- No volume change occurs during this phase.
4. Ejection
- Valve Dynamics:
- Semilunar valves open as ventricular pressure surpasses aortic and pulmonary artery pressures.
- Blood Flow:
- Initially rapid, slowing as ventricular repolarization occurs.
- CVP Waveform:
- X-descent occurs as the tricuspid valve is pulled downward by RV contraction, increasing RA volume and reducing pressure.
- End-Systolic Volume (ESV):
- Volume of blood remaining in the ventricles post-ejection.
- Second Heart Sound (S2):
- Closure of semilunar valves produces S2, with inspiration causing physiological splitting.
- Dicrotic Notch:
- Positive deflection on the aortic pressure waveform due to elastic recoil of the aortic valve and aorta.
5. Isovolumetric Relaxation
- Valve Dynamics:
- Semilunar valves close, and ventricular pressure declines without a change in volume.
- CVP Waveform:
- V-wave reflects atrial pressure rise due to venous return.
6. Rapid Filling
- Pressure Dynamics:
- Atrial pressure > ventricular pressure, leading to AV valve opening.
- Blood Flow:
- Rapid flow of blood from the atria to the ventricles along the pressure gradient.
- CVP Waveform:
- Y-descent represents atrial pressure decline as blood enters the ventricles.
- Third Heart Sound (S3):
- Normally absent; its presence may indicate increased atrial blood volume entering a poorly compliant ventricle (e.g., in mitral regurgitation).
Pressure Volume Loops
Phases of the Cardiac Cycle
- Isovolumetric Contraction:
- Represented as a vertical line indicating the increase in intraventricular pressure without a change in ventricular volume.
- Ventricular Ejection:
- Stroke volume (SV) is ejected into the aorta.
- Isovolumetric Relaxation:
- Represented as a vertical line indicating the fall in intraventricular pressure without a change in ventricular volume.
- Diastolic Ventricular Filling:
- The ventricle fills with blood, preparing for the next contraction.
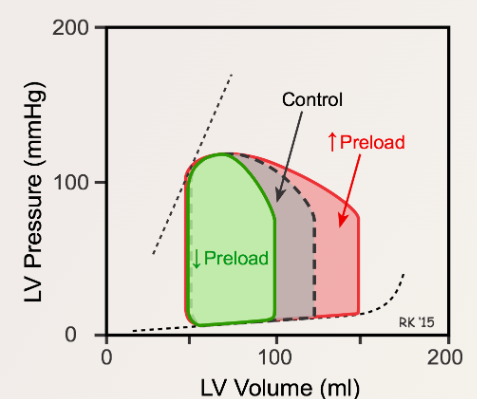
Increased Preload
- Width of the Loop: The width of the pressure–volume loop, representing SV, is increased due to the increase in left ventricular end-diastolic volume (LVEDV).
- Left Ventricular End-Systolic Volume (LVESV): Increases slightly due to an increase in afterload (aortic pressure) caused by the greater cardiac output (CO).
- End-Diastolic Pressure-Volume Relationship (EDPVR): Reflects the passive diastolic compliance of the left ventricle (LV). Beyond a certain preload, LV end-diastolic pressure (LVEDP) increases sharply, reflecting the nonlinear compliance of the LV wall due to the elastic proteins and connective tissue within the myocardium reaching their elastic limit.
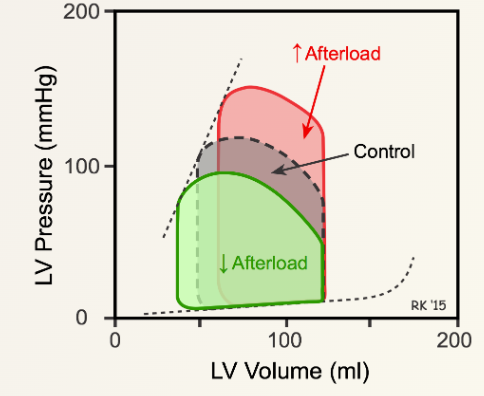
Increased Afterload
- Ejection Volume: Reduced volume of blood is ejected from the LV, leading to an increased LVESV.
- LVEDV: Increases due to the addition of venous return. According to Starling’s law, an increase in LVEDV causes an increase in myocardial contractility.
- Stroke Volume: Initially decreases, but returns to near normal levels as myocardial contractility increases. The pressure–volume loop becomes taller and thinner.
Relation to Cardiac Work
External Work (Stroke Work)
- Definition: The energy expended by the ventricle to eject blood under pressure during systole.
- Representation: The area within the ventricular pressure-volume loop corresponds to the external work performed during a single cardiac cycle.
Internal Work (Pressure Work)
- Definition: Energy used during isovolumetric contraction, where no shortening of contractile proteins occurs.
- Mechanism: This energy is dissipated as heat during diastole and is referred to as potential energy.
- Representation: The internal work is depicted as the area enclosed by:
- The end-systolic pressure-volume relationship (ESPVR),
- The end-diastolic pressure-volume relationship (EDPVR),
- The lines of isovolumetric relaxation.
Total Cardiac Work
- Definition: The sum of external and internal work, represented as the pressure-volume area (PVA).
- Clinical Correlation: PVA has a strong correlation with myocardial oxygen consumption, reflecting the total energy expenditure of the heart.
Effects on Cardiac Work
Effect of Preload
- Increased Preload:
- Enhances external work due to greater stroke volume.
- Results in an increased myocardial oxygen demand.
Effect of Afterload
- Increased Afterload:
- Increases internal work by requiring more energy for isovolumetric contraction.
- Elevates myocardial oxygen demand without significantly increasing external work.
Effect of Contractility
- Increased Myocardial Contractility:
- Augments external work by improving stroke volume and ejection efficiency.
- Internal work is typically not significantly altered.
Right Ventricular Pressure-Volume Loop
Key Characteristics
-
Lower Operating Pressure:
- The right ventricle functions at lower pressures than the left ventricle.
-
Afterload and Pulmonary Vascular Resistance (PVR):
- The right ventricle faces lower afterload and PVR compared to the systemic resistance encountered by the left ventricle.
-
Stroke Volume (SV):
- Despite ejecting the same volume as the left ventricle, the pressure-volume loop area—and thus the stroke work—of the right ventricle is only 20–25% of the left ventricle’s stroke work.
Ejection Dynamics
-
Timing of Ejection:
- Right ventricular ejection begins early in systole, and ventricular volume decreases shortly after pressure starts to rise.
-
Stroke Work Proportion:
- Stroke work comprises a larger proportion of total work in the right ventricle compared to the left ventricle.
Susceptibility to Failure
- Pulmonary Hypertension:
- The right ventricle is more vulnerable to failure under conditions of pulmonary hypertension than the left ventricle is to systemic hypertension.
Diastolic and Systolic Heart Failure
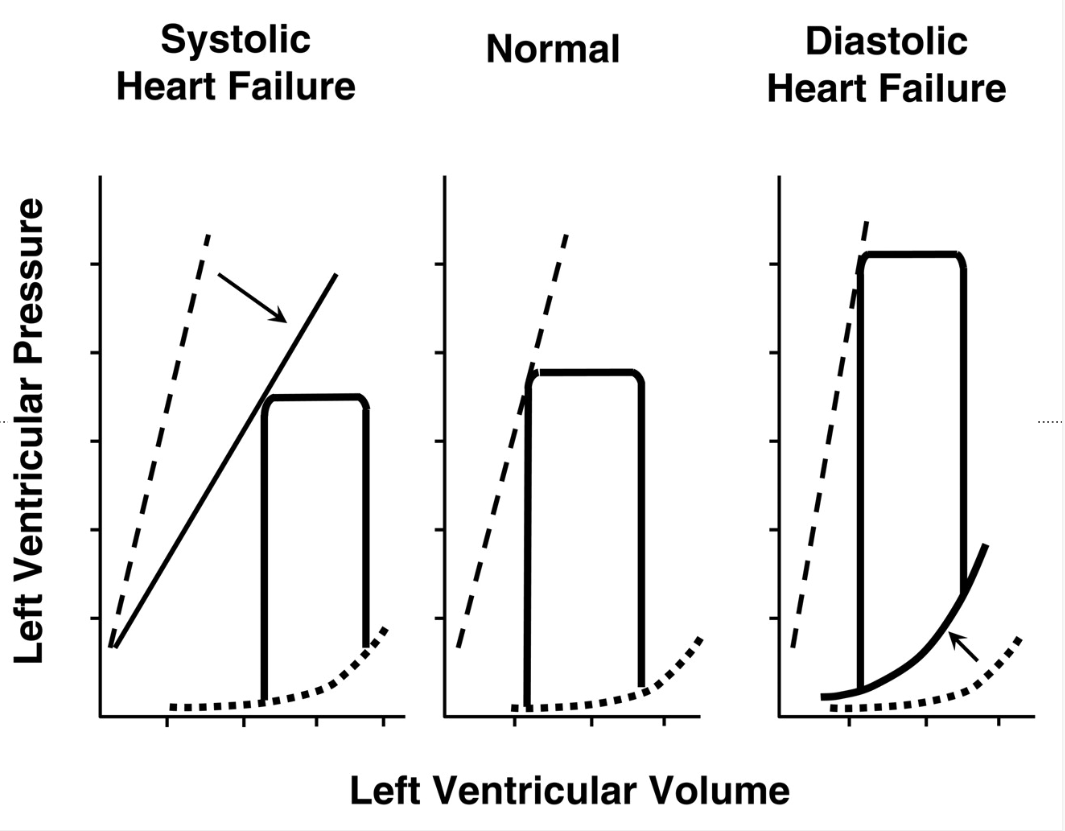
1. Systolic Heart Failure
- The ESPVR (dashed line) is shifted downward and to the right (↓ contractility).
- The pressure-volume loop is wider, indicating an increased end-diastolic volume (EDV) due to reduced ejection fraction.
- The stroke volume (SV) is reduced, meaning the heart pumps out less blood per beat.
- This reflects a weakened myocardium with reduced systolic function.
2. Normal
- This represents a healthy left ventricle with a normal pressure-volume loop.
- The ESPVR and EDPVR are in normal positions.
- The heart effectively fills and ejects blood without dysfunction.
3. Diastolic Heart Failure
- The ESPVR remains normal, indicating that systolic function is preserved.
- The EDPVR (dotted line) is shifted upward, meaning the ventricle is less compliant (stiffer), leading to higher filling pressures at lower volumes.
- The pressure-volume loop is narrower, showing a decreased stroke volume despite a normal ejection fraction.
- This reflects diastolic dysfunction due to impaired ventricular relaxation.
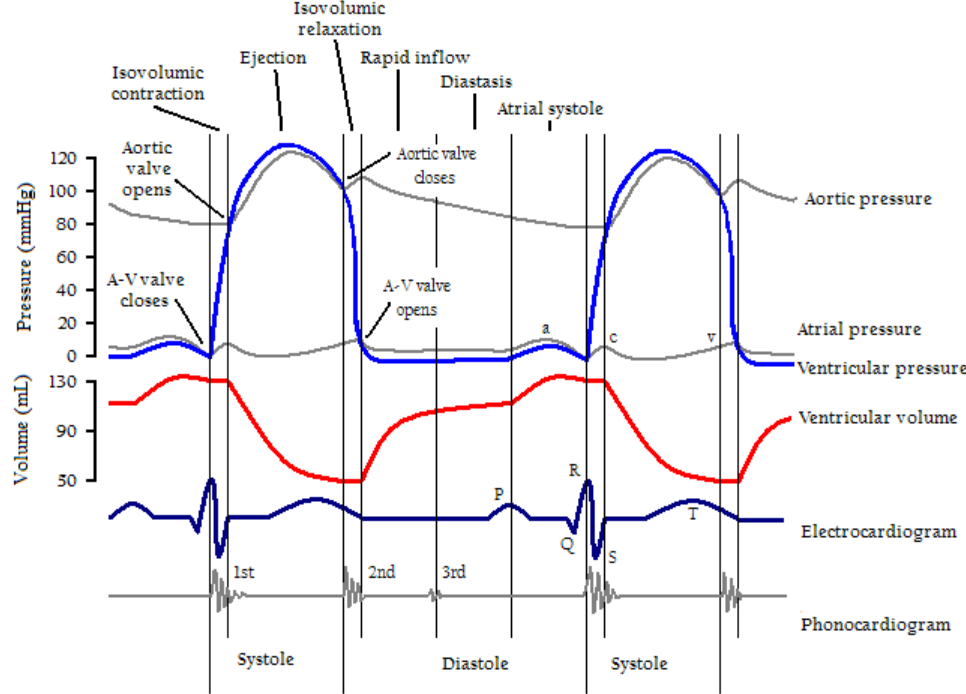
Wiggers Diagram
Cardiac Failure
Cardiac failure occurs when the heart is unable to provide sufficient cardiac output (CO) to meet the metabolic demands of the body’s tissues.
Types of Cardiac Failure
High-Output Heart Failure
- Definition: Cardiac output (CO) is normal or elevated, but it is insufficient to meet excessively high tissue oxygen (O₂) demands.
- Examples: Conditions such as thyrotoxicosis and pregnancy, where metabolic needs are abnormally elevated.
Low-Output Heart Failure
- Definition: Cardiac output is insufficient to meet normal tissue oxygen demands.
Consequences of Cardiac Failure
Forward Heart Failure
- Pathophysiology: Inadequate cardiac output leads to reduced oxygen delivery to peripheral tissues.
- Clinical Manifestations:
- Fatigue due to inadequate muscle oxygenation.
- Renal failure (RF) resulting from reduced renal perfusion.
- Ischemic heart disease (IHD) due to impaired coronary blood flow.
Backward Heart Failure
-
Pathophysiology: Elevated pressures in the left atrium (LAP) and pulmonary artery (PAP) result in increased hydrostatic pressure, causing fluid extravasation.
-
Progression:
- Pulmonary edema arises from fluid accumulation in the lungs.
- Sustained pulmonary hypertension increases right ventricular (RV) afterload, progressing to right-sided heart failure.
-
Clinical Manifestations:
- Peripheral edema due to systemic venous congestion.
- Ascites and hepatomegaly as a result of increased systemic venous pressure.
Frank-Starling Mechanism and Cardiac Failure
- Normal Mechanism: The Frank-Starling law explains how the heart adjusts its output based on the length of cardiac muscle fibers (sarcomeres). Optimal sarcomere length maximizes the force of contraction, enabling effective ejection of blood.
- Failure Mechanism:
- In cardiac failure, excessive sarcomere stretch exceeds the optimal length, impairing myocyte cross-bridge formation and reducing contraction force.
- This leads to diminished cardiac output and further exacerbates heart failure.
Laplace’s Law and Cardiac Failure
-
Relation to Cardiac Failure:
- In an enlarged heart with increased ventricular radius (r), the wall tension (T) required to maintain the same pressure (P) increases, worsening cardiac workload.
- This higher tension exacerbates myocardial oxygen demand and contributes to progressive cardiac dysfunction.
Formula
- P=2T/r
where: - P is the transmural pressure.
- T is the surface tension.
- r is the radius.
- Greater ventricular radius: For the same active tension generated in the ventricular wall, an LV of greater radius will produce a lower pressure than a ventricle of smaller radius. This again increases the myocardial work required to generate the same pressure
Compensation Mechanisms in Cardiac Failure
Sympathetic Stimulation
- Effects:
- Increases myocardial contractility and HR to maintain CO despite reduced stroke volume.
- Long-Term Consequences:
- Chronic stimulation leads to β-receptor downregulation, reducing the heart’s responsiveness to sympathetic input.
Expansion of Blood Volume
-
Mechanism:
- Reduced CO decreases renal blood flow, activating the RAAS.
- RAAS leads to sodium and water retention, increasing LVEDV and preload.
-
Counteraction:
- ANP and BNP oppose RAAS activity by promoting natriuresis and diuresis.
Cardiac Reflexes
Bowditch Effect (Staircase Effect)
-
Mechanism:
- At higher HRs, calcium accumulation in myocytes during systole increases myocardial contractility.
- Shortened diastolic intervals reduce sodium efflux, enhancing intracellular calcium levels.
-
Clinical Similarity:
- Comparable to the action of digoxin, which inhibits the Na⁺/K⁺-ATPase, increasing intracellular calcium.
Arterial Baroreceptor Reflex
- Function:
- Detects changes in MAP via mechanoreceptors in the aortic arch and carotid sinus.
- Response to Changes in MAP:
- Increased MAP: Activates parasympathetic pathways, reducing HR and SVR.
- Decreased MAP: Activates sympathetic pathways, increasing HR and SVR.
- Pathway: Signals travel via the glossopharyngeal (carotid sinus) and vagus nerves (aortic arch) to the vasomotor center in the medulla.
Bainbridge Reflex
- Mechanism:
- Low-pressure mechanoreceptors in the right atrium respond to increased CVP, increasing HR via sympathetic stimulation of the SA node.
- Examples:
- Observed in conditions like respiratory sinus arrhythmia and uterine autotransfusion.
Chemoreceptor Reflex
- Function:
- Peripheral chemoreceptors in the carotid and aortic bodies respond to hypoxemia, hypercapnia, and acidosis.
- Response:
- Stimulates sympathetic outflow, increasing HR and MAP.
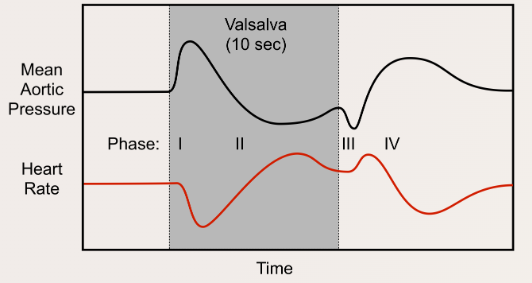
Valsalva Maneuver
Description
- Awake: Forced expiration against a closed glottis (~40 cmH₂O intrathoracic pressure for 10 seconds).
- Under Anesthesia: Airway pressure is increased to 40 cmH₂O for 10 seconds using a closed APL valve.
Phases and Effects
- Phase 1:
- Increased intrathoracic pressure transiently elevates SV and MAP, causing reflex bradycardia via the baroreceptor reflex.
- Phase 2:
- Sustained high intrathoracic pressure reduces venous return, decreasing SV and MAP. Reflex tachycardia attempts to normalize MAP.
- Phase 3:
- Release of airway pressure further decreases SV and MAP as intrathoracic vessels refill. Reflex tachycardia persists.
- Phase 4:
- Restored LV preload increases MAP, leading to overshoot corrected by reflex bradycardia. Both MAP and HR return to baseline.
Clinical Applications
- Termination of Supraventricular Tachycardia:
- Phase 4 vagal stimulation slows AV node conduction.
- Diagnosis of Murmurs:
- Increases intensity of hypertrophic obstructive cardiomyopathy murmur.
- Decreases most other murmurs, including aortic stenosis.
- Test of Autonomic Function:
- Absence of reflex responses in Phases 2 and 4 suggests autonomic dysfunction.
- Diagnosis of High Venous Pressure:
- A square-wave response indicates elevated MAP without reflex changes, seen in conditions like congestive heart failure and constrictive pericarditis.
Cardiac Physical Examination
Pulsus Paradoxus
Normal Physiology
- Inspiration:
- ↑ Lung volume → ↑ Intra-vascular volume within pulmonary blood vessels
- ↑ Lung capacitance for blood
- ↓ Right heart afterload
- Result:
- More blood returns to right heart → More blood enters and pools in pulmonary vasculature
- ↓ Blood returns to left heart → ↓ Its filling
- ↓ Left heart stroke volume/cardiac output
- ↓ BP on inspiration (<10mmHg)
Abnormal Physiology
- With Obstructive Lung Diseases (e.g., COPD)
- Mechanism:
- Lungs are hyperinflated, and vascular beds are more expanded
- On inspiration, ↑↑ Blood enters lungs and pools within pulmonary vasculature
- ↓↓ Forward blood flow from lungs to left heart
- Result:
- ↓↓ Left heart stroke volume/cardiac output
- Mechanism:
- With Cardiac Pathology Extending to Myocardium (Cardiac Tamponade, Constrictive Pericarditis)
- Mechanism:
- As ↑↑ Blood fills right heart on inspiration, external constraints on myocardium (e.g., cardiac expansion, interventricular septum is pushed into left ventricle)
- No room in the pericardial sac for the left ventricle to expand and maintain normal end diastolic volume (i.e., ↓↓ Left ventricle filling)
- Result:
- ↓↓ Left heart stroke volume/cardiac output
- Mechanism:
- With Vascular Pathology (Rare)
- Mechanism:
- Vena Cava Obstruction:
- Obstruction by neoplasm or external compression by masses/fibrosis (e.g., obesity, pregnancy)
- ↓↓ Venous return to right heart
- Pulmonary Embolism:
- Thrombi in the pulmonary arteries ↓ Blood filling
- On inspiration, as pulmonary intra-vascular volume expands and blood pools within, flow into the left heart ↓↓↓
- Vena Cava Obstruction:
- Result:
- ↓↓↓ Left heart stroke volume/cardiac output
- Mechanism:
Pulsus Paradoxus
- Definition:
- Exaggerated ↓ in systolic BP on inspiration (>10mmHg)
JVP
Kussmaul’s Sign Explained
Mechanism of Kussmaul’s Sign
-
Inspiration:
- ↓ Pressure in thoracic cavity
- More venous blood tries to enter the low-pressure thoracic cavity via the right ventricle
-
Pathologies:
- Restrictive Cardiomyopathy:
- Myocardium of the right ventricle becomes fibrotic and stiffer
- ↓ Right ventricle wall compliance
- ↓ Ability of the right ventricle to accommodate higher venous return
- Right Ventricle Myocardial Infarct:
- Myocardium of the right ventricle becomes fibrotic and stiffer
- ↓ Right ventricle wall compliance
- ↓ Ability of the right ventricle to accommodate higher venous return
- Constrictive Pericarditis:
- Inflamed, fibrotic pericardium restricts expansion of the heart
- Right ventricle prevented from fully expanding
- ↓ Ability of the right ventricle to accommodate higher venous return
- Cardiac Tamponade (Rare):
- Excessive pericardial fluid compresses heart walls on all sides
- Right ventricle prevented from fully expanding
- ↓ Ability of the right ventricle to accommodate higher venous return
- Result:
- Backup of venous blood into the right atrium and preceding internal jugular veins
- Kussmaul’s sign:
- JVP increases with inspiration
Jugular Venous Pressure (JVP): Physical Exam Features
The Jugular Venous Pressure (JVP)
- Definition:
- Blood pressure in the internal jugular veins
Exam Features
- Normal Physiology:
- Venous blood pressure is normally very low
- Jugular venous pulse (JVP) is visible and corresponds to the stages of the cardiac cycle
- Palpation:
- Non-palpable jugular veins
- Compression Test:
- Occludable internal jugular veins
- Waveform:
- A-wave: Pressure in the right atrium is transmitted into internal jugular veins
- V-wave: Blood passively fills the right atrium during ventricular systole
- Biphasic waveform
- Pressure Points:
- Pressing hard on the abdomen (overlying the liver)
- Blood is forced up into the right atrium → venous blood backup into internal jugular veins
- ↑ JVP
- Positional Changes:
- Tilting the head of the bed:
- Up: Blood in internal jugular veins settles to the bottom of the internal jugular vein (analogy: half-full tube of water is turned vertically) → ↑ JVP
- Down: Blood in internal jugular veins settles along the side of the internal jugular vein (analogy: half-full tube of water is turned horizontally) → ↓ JVP
- Tilting the head of the bed:
- Breathing:
- Intrathoracic pressure changes with respiration:
- Inspiration:
- ↓ Intrathoracic pressure
- Blood enters the internal jugular veins more readily
- Filling pressure of the right atrium and internal jugular veins ↓
- ↓ JVP
- Expiration:
- ↑ Intrathoracic pressure
- Blood is pumped into the pulmonary circulation
- Filling pressure of the right atrium and internal jugular veins ↑
- ↑ JVP
- Inspiration:
- Intrathoracic pressure changes with respiration:
- Body Position:
- Pulmonary circulation accepts more venous blood (↑ Preload), ↑ stroke volume of next heart-beat, shifting more blood into arteries
- JVP changes with body position
- Observation:
- Since the internal jugular veins are continuous with the right atrium, the JVP is a reliable estimate of right atrial blood pressure (Central Venous Pressure). The JVP on the right side is a better “barometer” than the JVP on the left, because the right internal jugular communicates more directly with the right atrium.
- JVP should return to normal within 3 respiration cycles
Orthostatic Hypotension
Pathogenesis and Clinical Findings
Pathophysiology
-
Normal Physiology:
- Venous return → Stroke volume → Arterial blood pressure
- Appropriate baroreceptor reflex response
- Stretch of arterial baroreceptors → Baroreceptor firing → Output from nucleus tractus solitarius in the medulla:
- ↓ Vagus nerve activity
- ↓ Parasympathetic activity
- ↑ Sympathetic activity
- ↑ Heart rate and contractility
- ↑ Peripheral vasoconstriction
- Result:
- Minimal change in arterial blood pressure
-
Abnormal Physiology:
- Cardiac output is diminished, or the effective arterial blood volume is decreased:
- ↓ Venous return
- Appropriate, but inadequate baroreceptor reflex response:
- Impaired baroreceptor reflex response
- Impaired ability to ↑ Sympathetic activity
- Result:
- Minimal heart rate change
- ↓ SAP and/or ↓ DAP
- Orthostatic hypotension: Sustained reduction in SAP of at least 20 mmHg or DAP of at least 10 mmHg within 3 minutes of standing
- Cardiac output is diminished, or the effective arterial blood volume is decreased:
Mechanism of Orthostatic Hypotension
-
Non-neurogenic:
- Hypovolemia, cardiac pump impairments (e.g., aortic stenosis), medications (e.g., diuretics, vasodilators, direct vasodilators, and tricyclic anti-depressants)
-
Neurogenic:
- Spinal cord injury, autonomic neuropathies, pure autonomic failure, Parkinson’s disease, multiple system atrophy
Symptoms
- Dizziness, visual blurring, cerebral hypoperfusion resulting from ↓ Arterial blood pressure
Links
- Vascular physiology
- Cardiac surgery
- Exercise testing and optimization
- Heart failure
- Valvular heart disease
References:
- Pinnell, J., Turner, S., & Howell, S. (2007). Cardiac muscle physiology. Continuing Education in Anaesthesia Critical Care &Amp; Pain, 7(3), 85-88. https://doi.org/10.1093/bjaceaccp/mkm013
- Chambers D, Huang CLH, Matthews G. Basic physiology for anaesthetists. Cambridge, United Kingdom: Cambridge University Press; 2015.
- Doyle, D. J. (2011). An introduction to cardiovascular physiology. British Journal of Anaesthesia, 107(1), 113-114. https://doi.org/10.1093/bja/aer176
- WFSAHQ. (n.d.). Introduction to Cardiovascular Physiology. Retrieved from https://resources.wfsahq.org/atotw/introduction-to-cardiovascular-physiology/
- The Calgary Guide to Understanding Disease. (2024). Retrieved June 5, 2024, from https://calgaryguide.ucalgary.ca/
- FRCA Mind Maps. (2024). Retrieved June 5, 2024, from https://www.frcamindmaps.org/
- Anesthesia Considerations. (2024). Retrieved June 5, 2024, from https://www.anesthesiaconsiderations.com/
Summaries
Cardiac physiology
Coronary anatomy and physiology
Copyright
© 2025 Francois Uys. All Rights Reserved.
id: “11b03ea1-e663-44cd-884c-d107e736df68”